Biking while Black: Racial bias in Oakland policing
Introduction
After his arrest, Najari asked me to help out with research and data analysis on racially-biased policing in Oakland. Since then, I’ve joined the newly-created “Safety and Policing” subcommittee of the Oakland Bicycle and Pedestrian Commission, and I’ve also been providing information to the team working on Let’s Bike Oakland, the bike plan update.
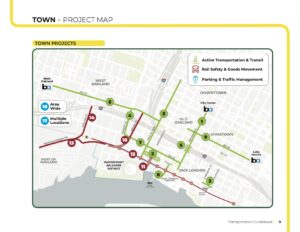
Let’s Bike Oakland did a lot of good engagement work with disadvantaged communities. and East and West Oakland residents identified racially-biased policing of cyclists as a significant barrier to biking. OakDOT’s is doing what it can to incorporate that feedback, but its leverage to address the structural problem is pretty limited. The final plan will use some of the analysis I’ve provided to highlight the scope of the problem, but I don’t think it will have much that’s substantial in terms of recommended actions.
So I’ve been working on digging further into the data, seeing what I can do to describe and visualize the problem in a way that might make a difference.
Data analysis
OPD has been under federal oversight for over 15 years now, partly because of its checkered history of policing, and it’s required to publish racial data on police stops, That report has included stop types (vehicle, bike or pedestrian) since 2016, so there’s a fairly rich data set available. The disparities is shows are striking, though unsurprising. City-wide, 24% of residents are Black, while 68% of police bike/ped stops are of Blacks.
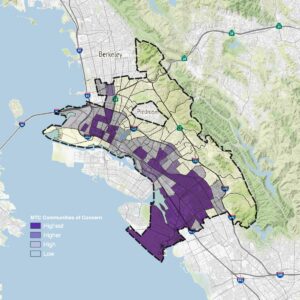
This disparity is partly a result of the location of the stops. 23% of the stops occur in just three police beats in West and East Oakland, and the residents of those beats are predominantly people of color (74%).
According to Lily Brown (OakDOT’s bike plan project lead), OPD justifies this spatial disparity with crime rates. There is more policing in those beats, they argue, because that’s where the crime’s happening. There’s a logical problem with this argument, because more crime will always be found where more policing is done. But leaving that aside, I wanted to look at whether OPD’s argument—that the bias is spatial rather than racial—holds up under scrutiny. It turns out the answer is no: Blacks are significantly more likely to be stopped no matter where they are in the city.
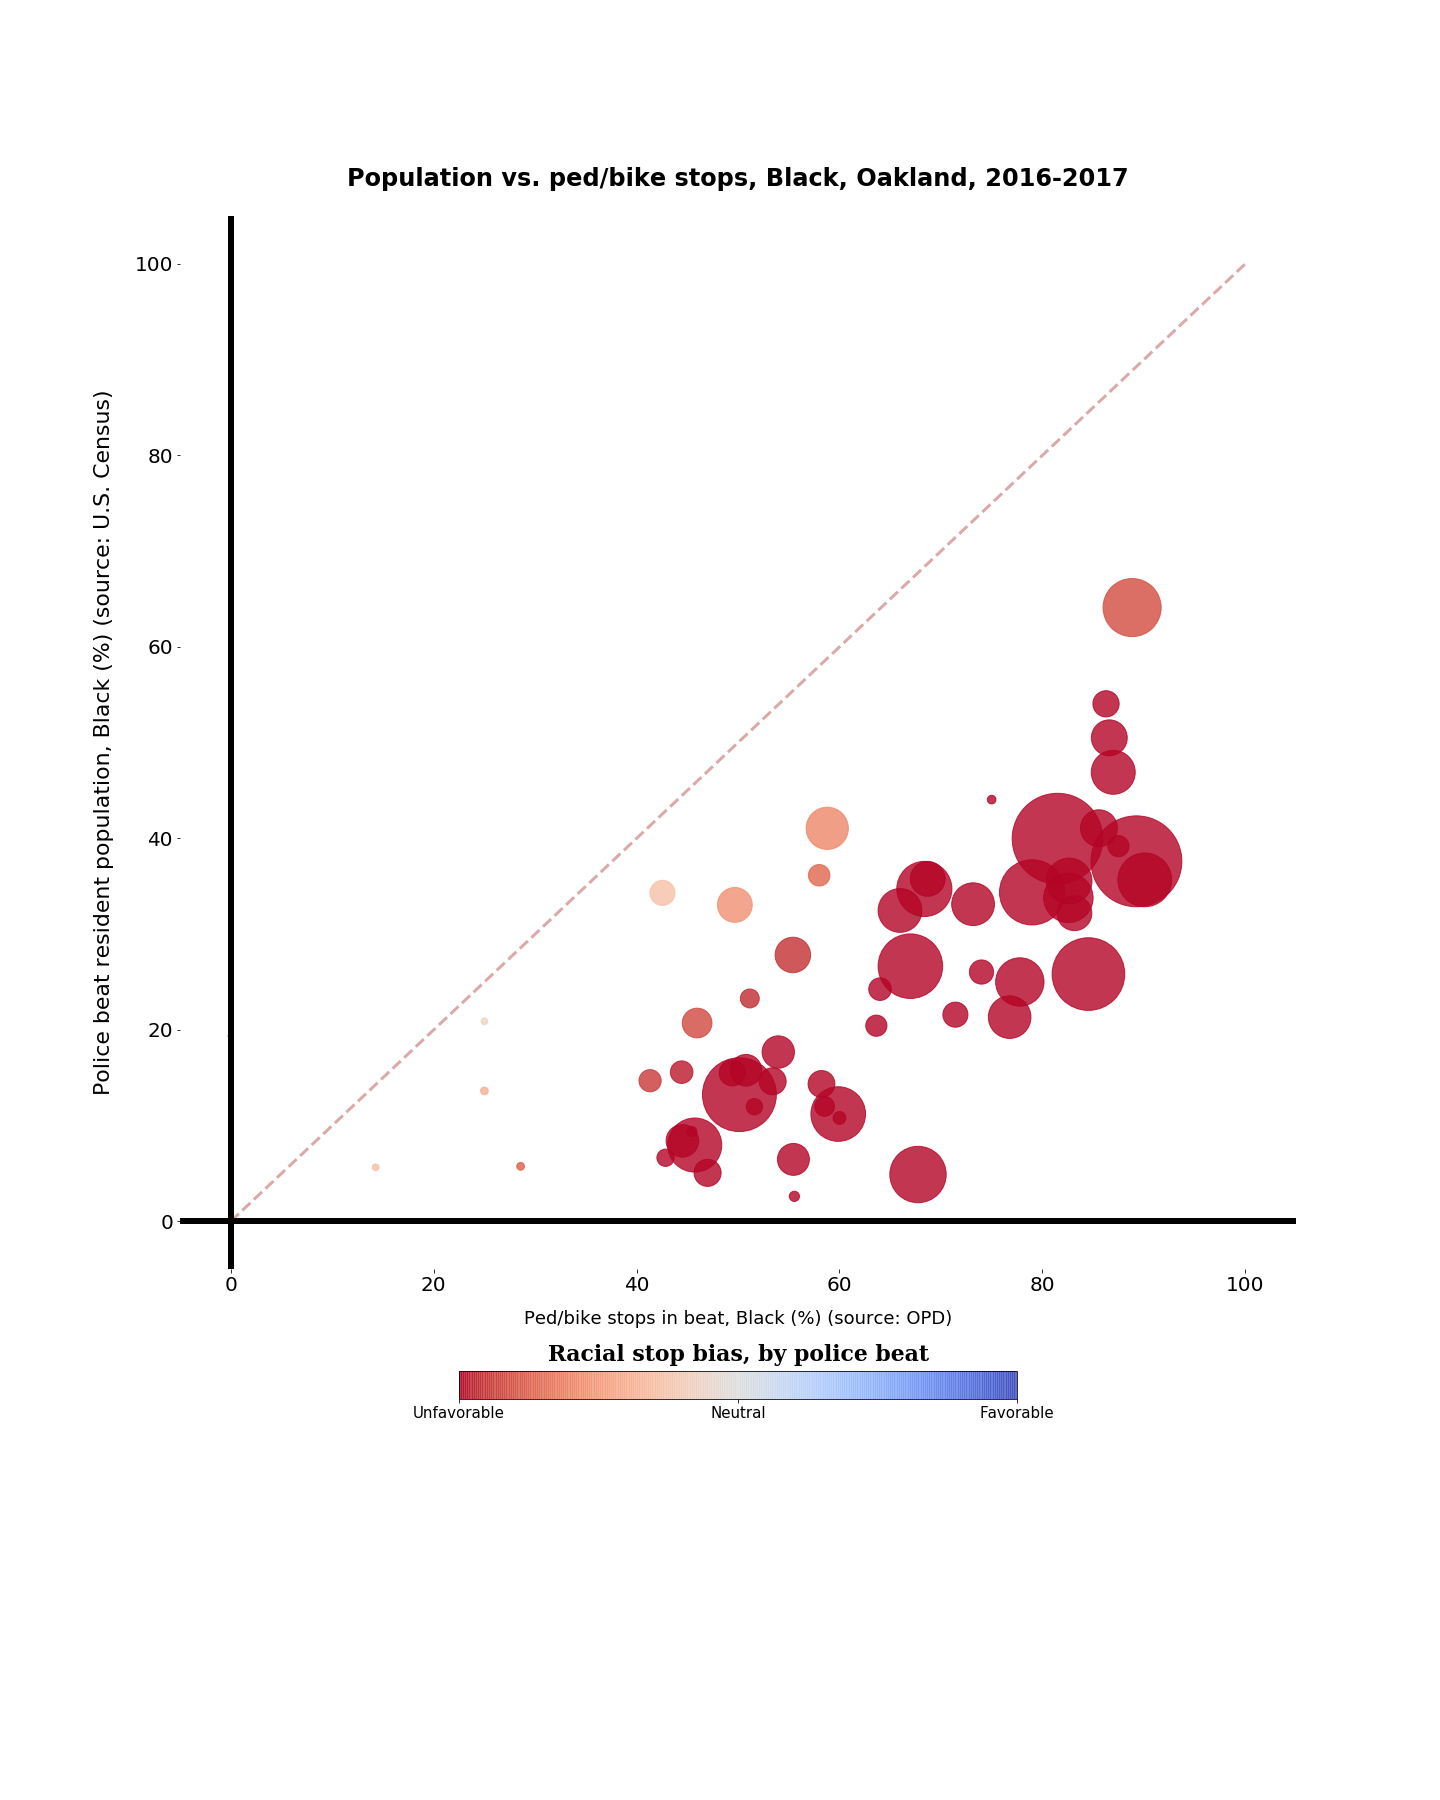
This graph shows the ratio of Black residents in each Oakland police beat to the number of bike and pedestrian stops of Blacks in that beat. (The two data sets are 2017 ACS 5-year estimates, and 2016-2017 OPD stop data.) Dot size represents the number of stops.
An unbiased sample would be clustered around the dotted line: a beat whose population is about 40% Black would have about 40% of its police stops be of Blacks. As this graph shows, the reality is nowhere close to that; the proportion of Blacks bike/ped stops is biased against Blacks in every police beat in Oakland. There are definitely more stops (larger bubbles) in police beats where more Blacks live, there are also beats like 19X (Eastlake/San Antonio), #1 overall in number of stops, where only 13% of the population is Black, but over 50% of the police bike/ped stops are of Blacks.
In my neighborhood (beat 9X), where 5% of the residents are Black, there were many fewer stops (100, compared with 722 in 19X), but 47% of them were of Blacks. In beat 28X (Frick/Mills College) there were only a total of 32 police stops, and 28 of them (87.5%) were of Blacks. So there is a spatial component to the police stop data, but even in neighborhoods with low stop rates, Blacks are stopped disproportionately. And it’s not close.
An interesting finding is that in Oakland, unlike some other cities, the Hispanic population does not appear to be experiencing the same type of police discrimination. Here’s the same graph on police stops of Hispanics.
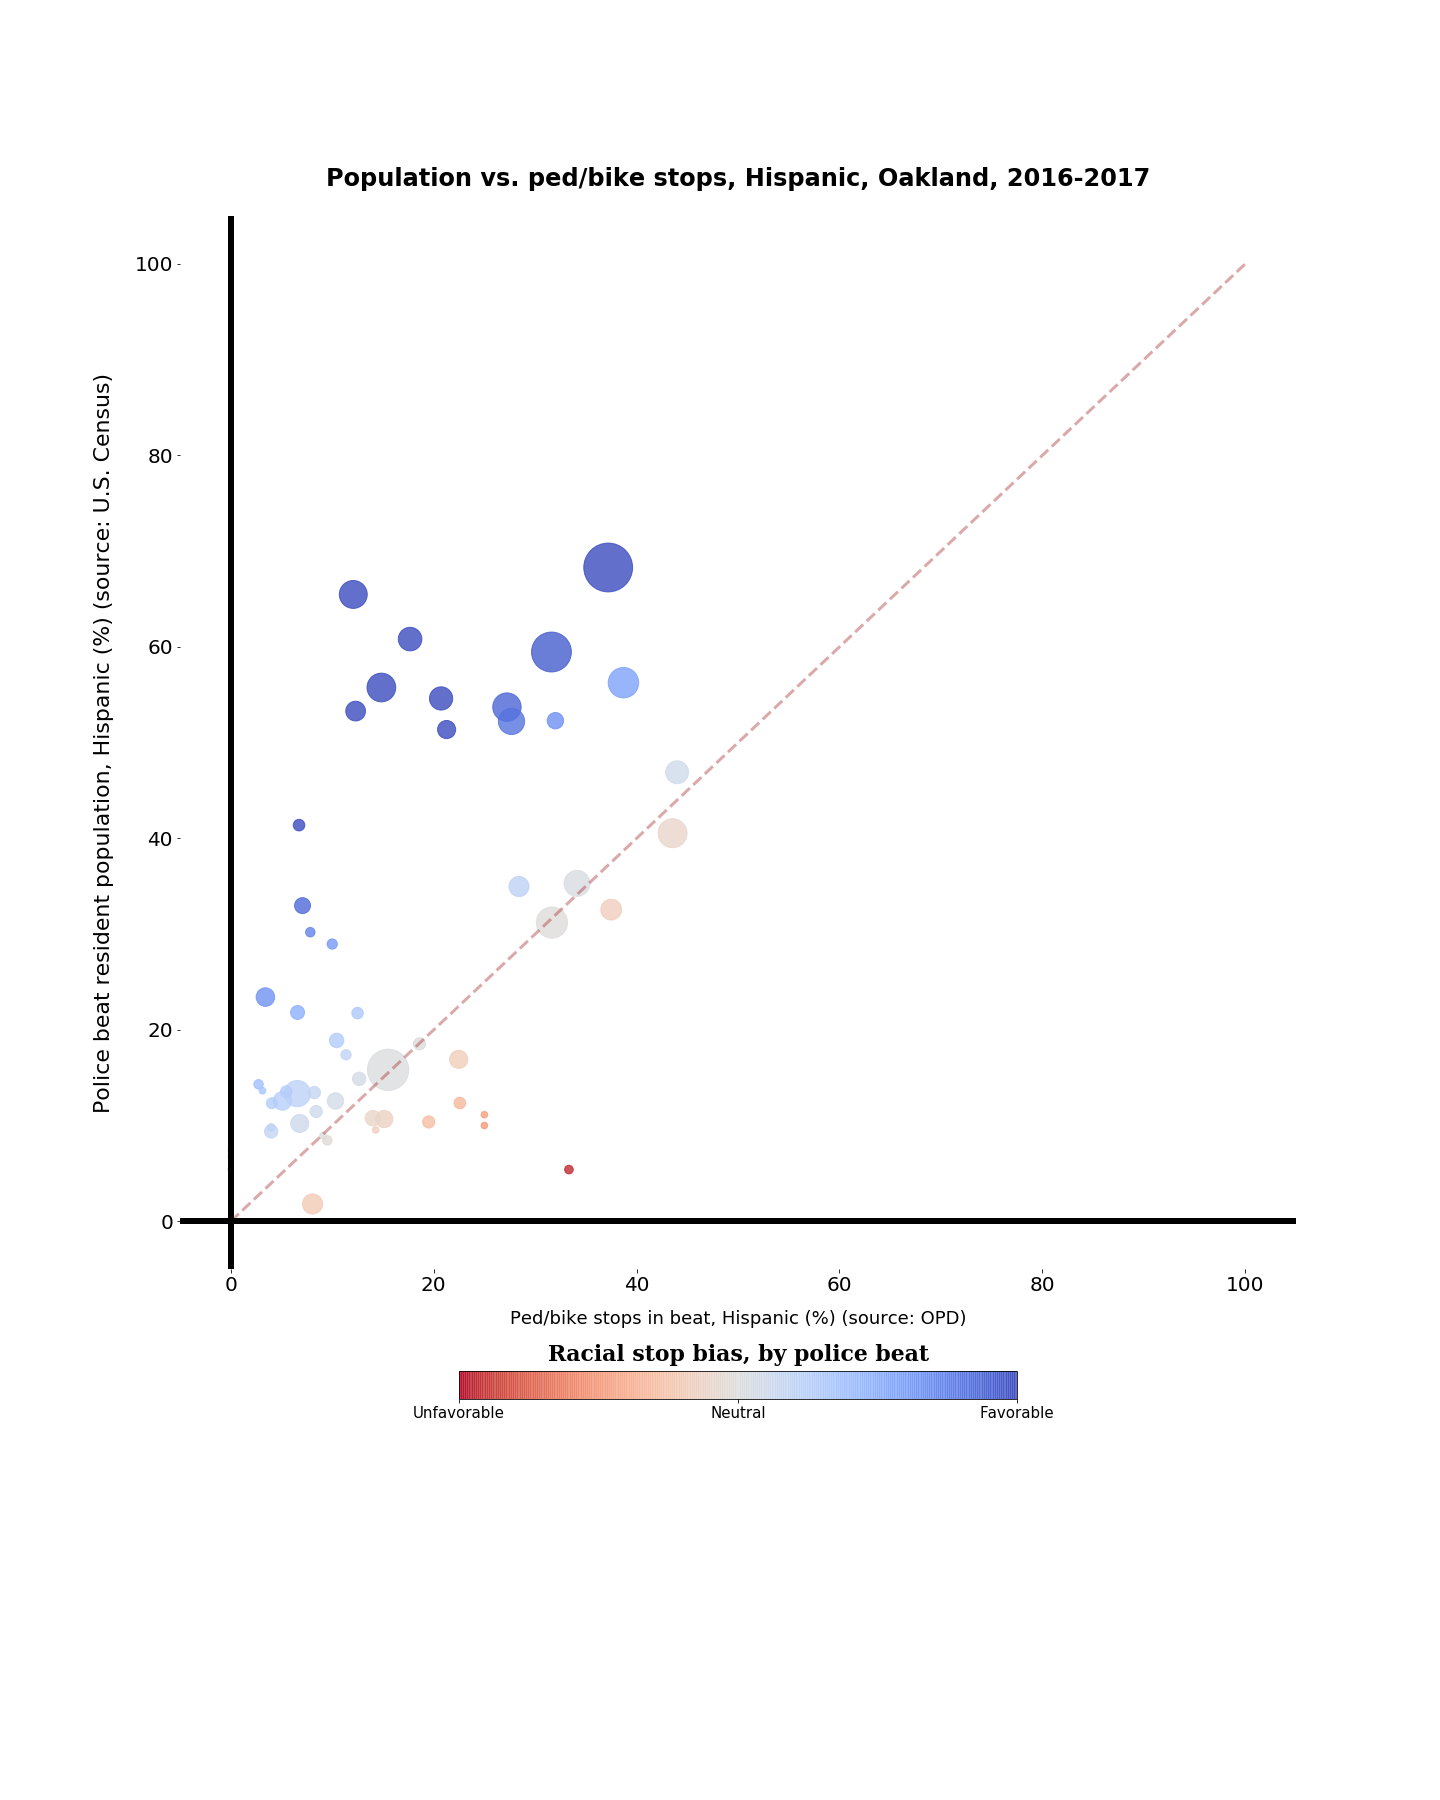
Overall, this shows a bias in favor of Hispanics; the proportion of police stops is generally lower than the population of the police beat. The largest dot shows that 38% of the stops in beat 23X (Fruitvale) are of Hispanics, but almost 70% of the population there is Hispanic.
I wondered if this chart was just showing how bad the discrimination against Blacks is. Maybe Hispanics are also discriminated against relative to Whites, but Blacks are even worse off. Turns out that’s not really what’s happening, either; when I pull out Blacks from the sample, Hispanics and Whites are more or less in parity.
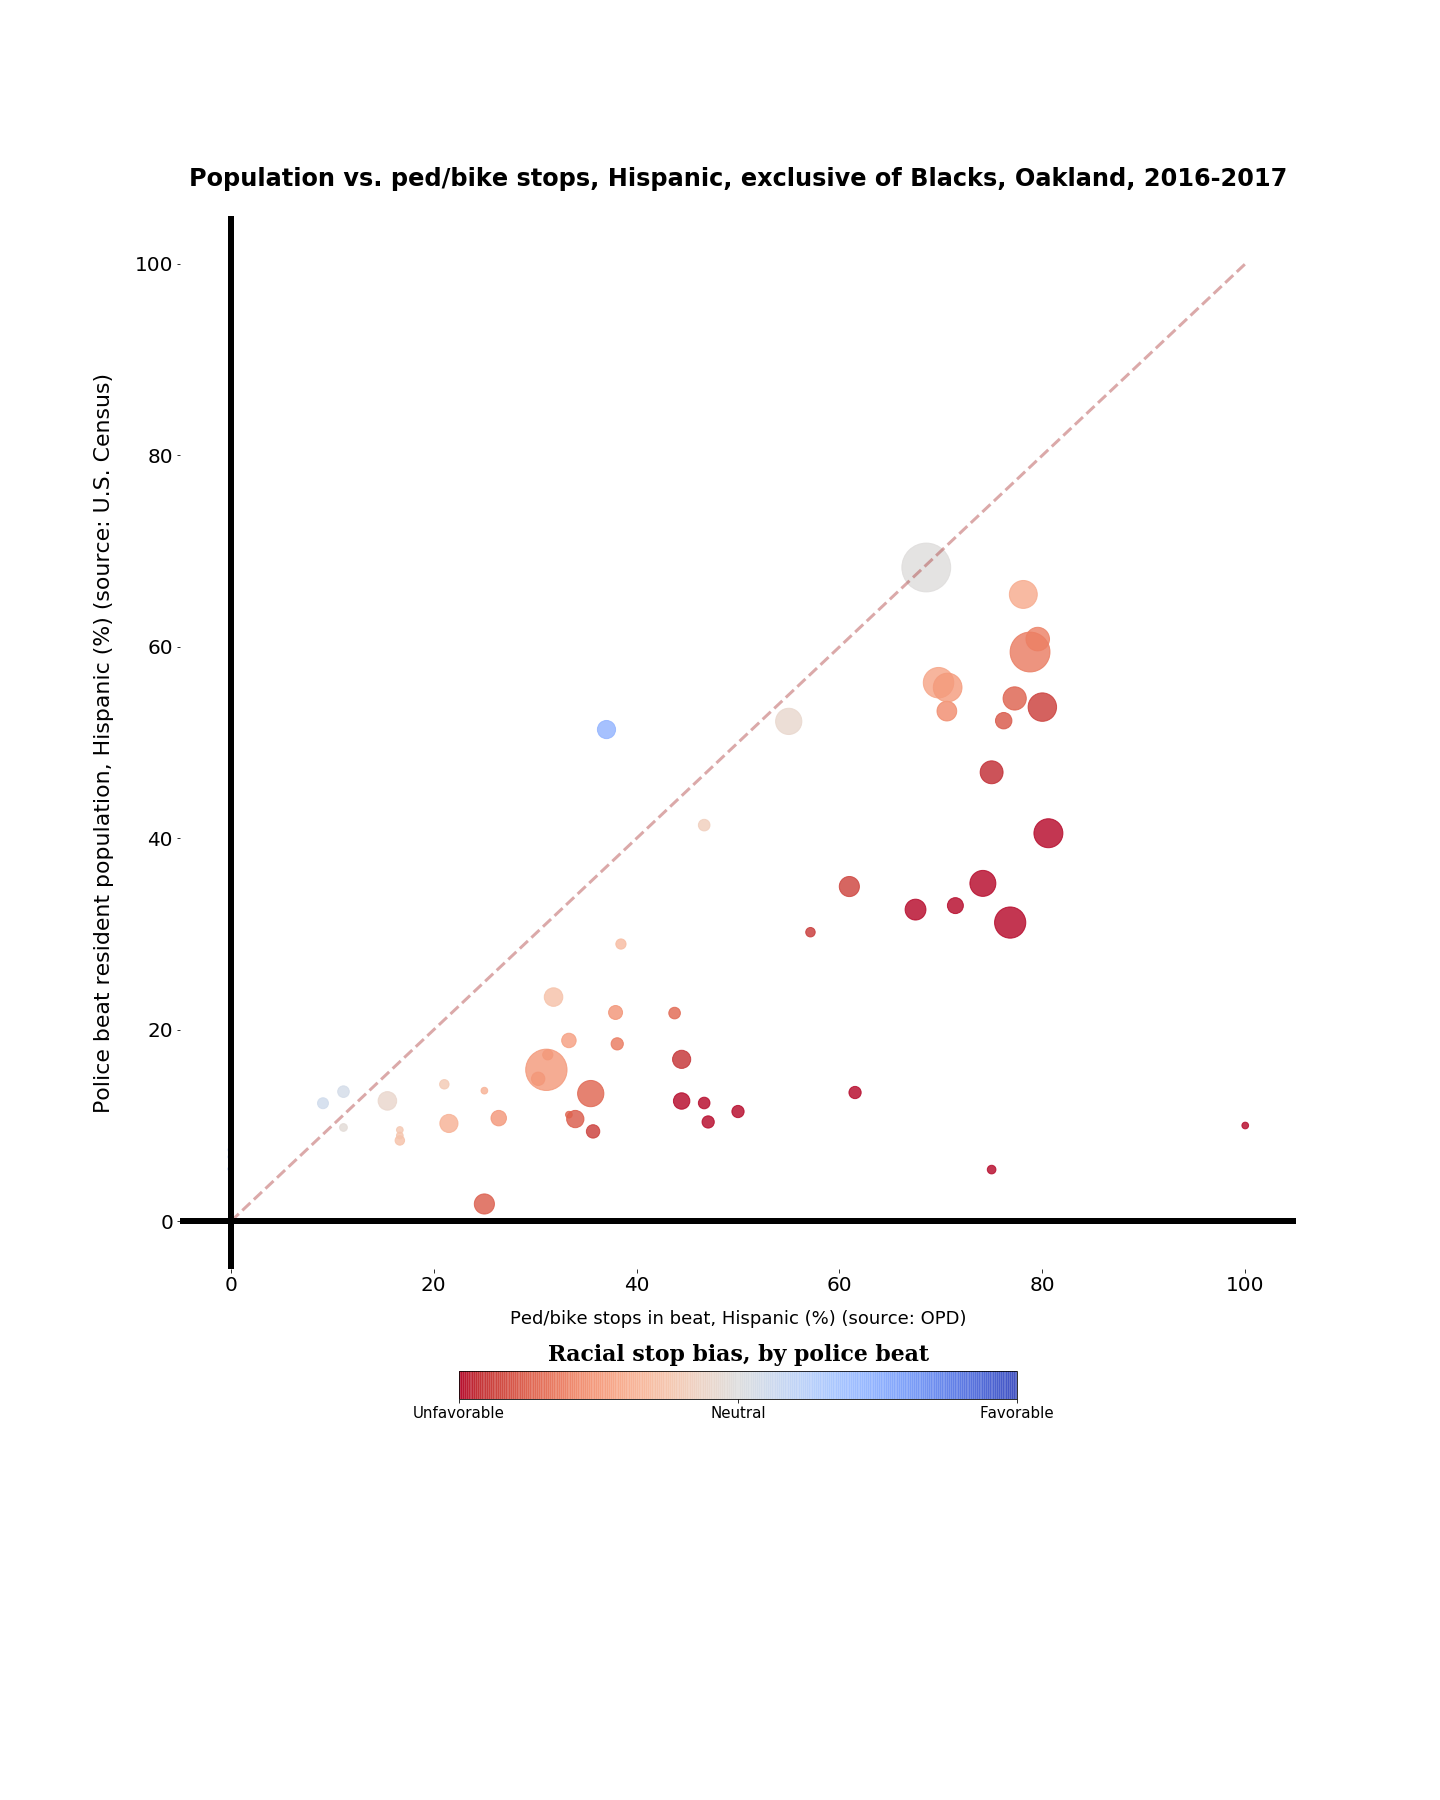
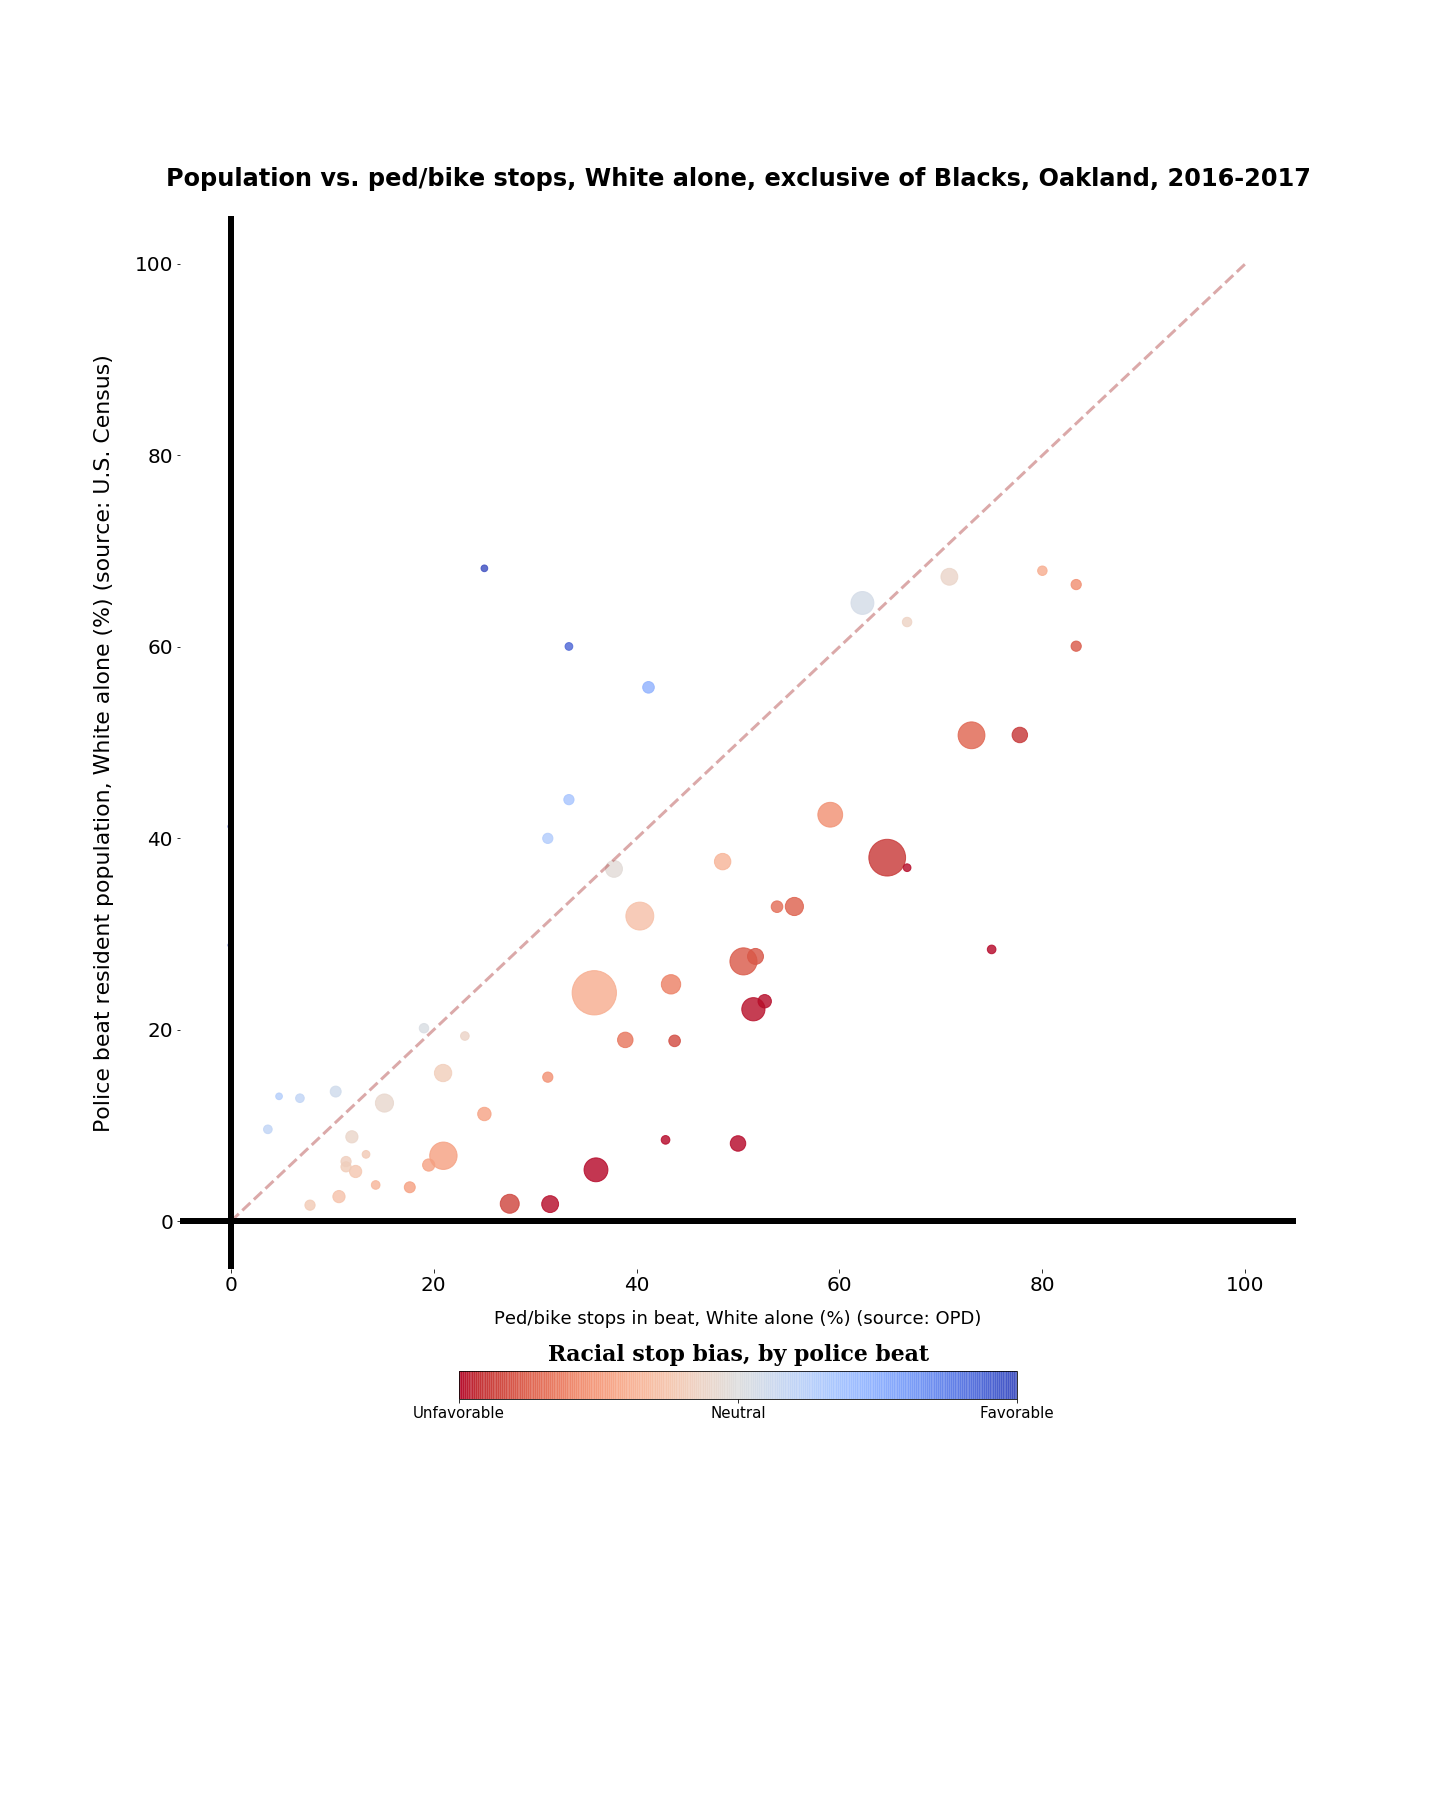

It turns out that Asians barely get stopped at all in Oakland. Only 4% of the bike/ped stops citywide are of Asians, while over 15% of the population is Asian. After excluding Blacks from the analysis, this bias in favor of Asians shows up in these charts as a moderate bias against both Whites and Hispanics city-wide. Whites and Hispanics have roughly equal populations (114K Whites, 113K Hispanics), and there were 940 stops of Whites and 1361 stops of Hispanics. This bias is small enough that the argument that it might be spatial rather than racial could possibly hold. But the bias against Blacks is clearly more than spatial.
Another possible explanation is that Blacks are more likely to be criminals, and these stops represent police getting bad guys off the street. The stop data includes a “Result of Encounter” field: felony or misdemeanor arrest, citation, warning, or no action. Here’s the Black chart again, this time looking only at stops which did not result in an arrest.
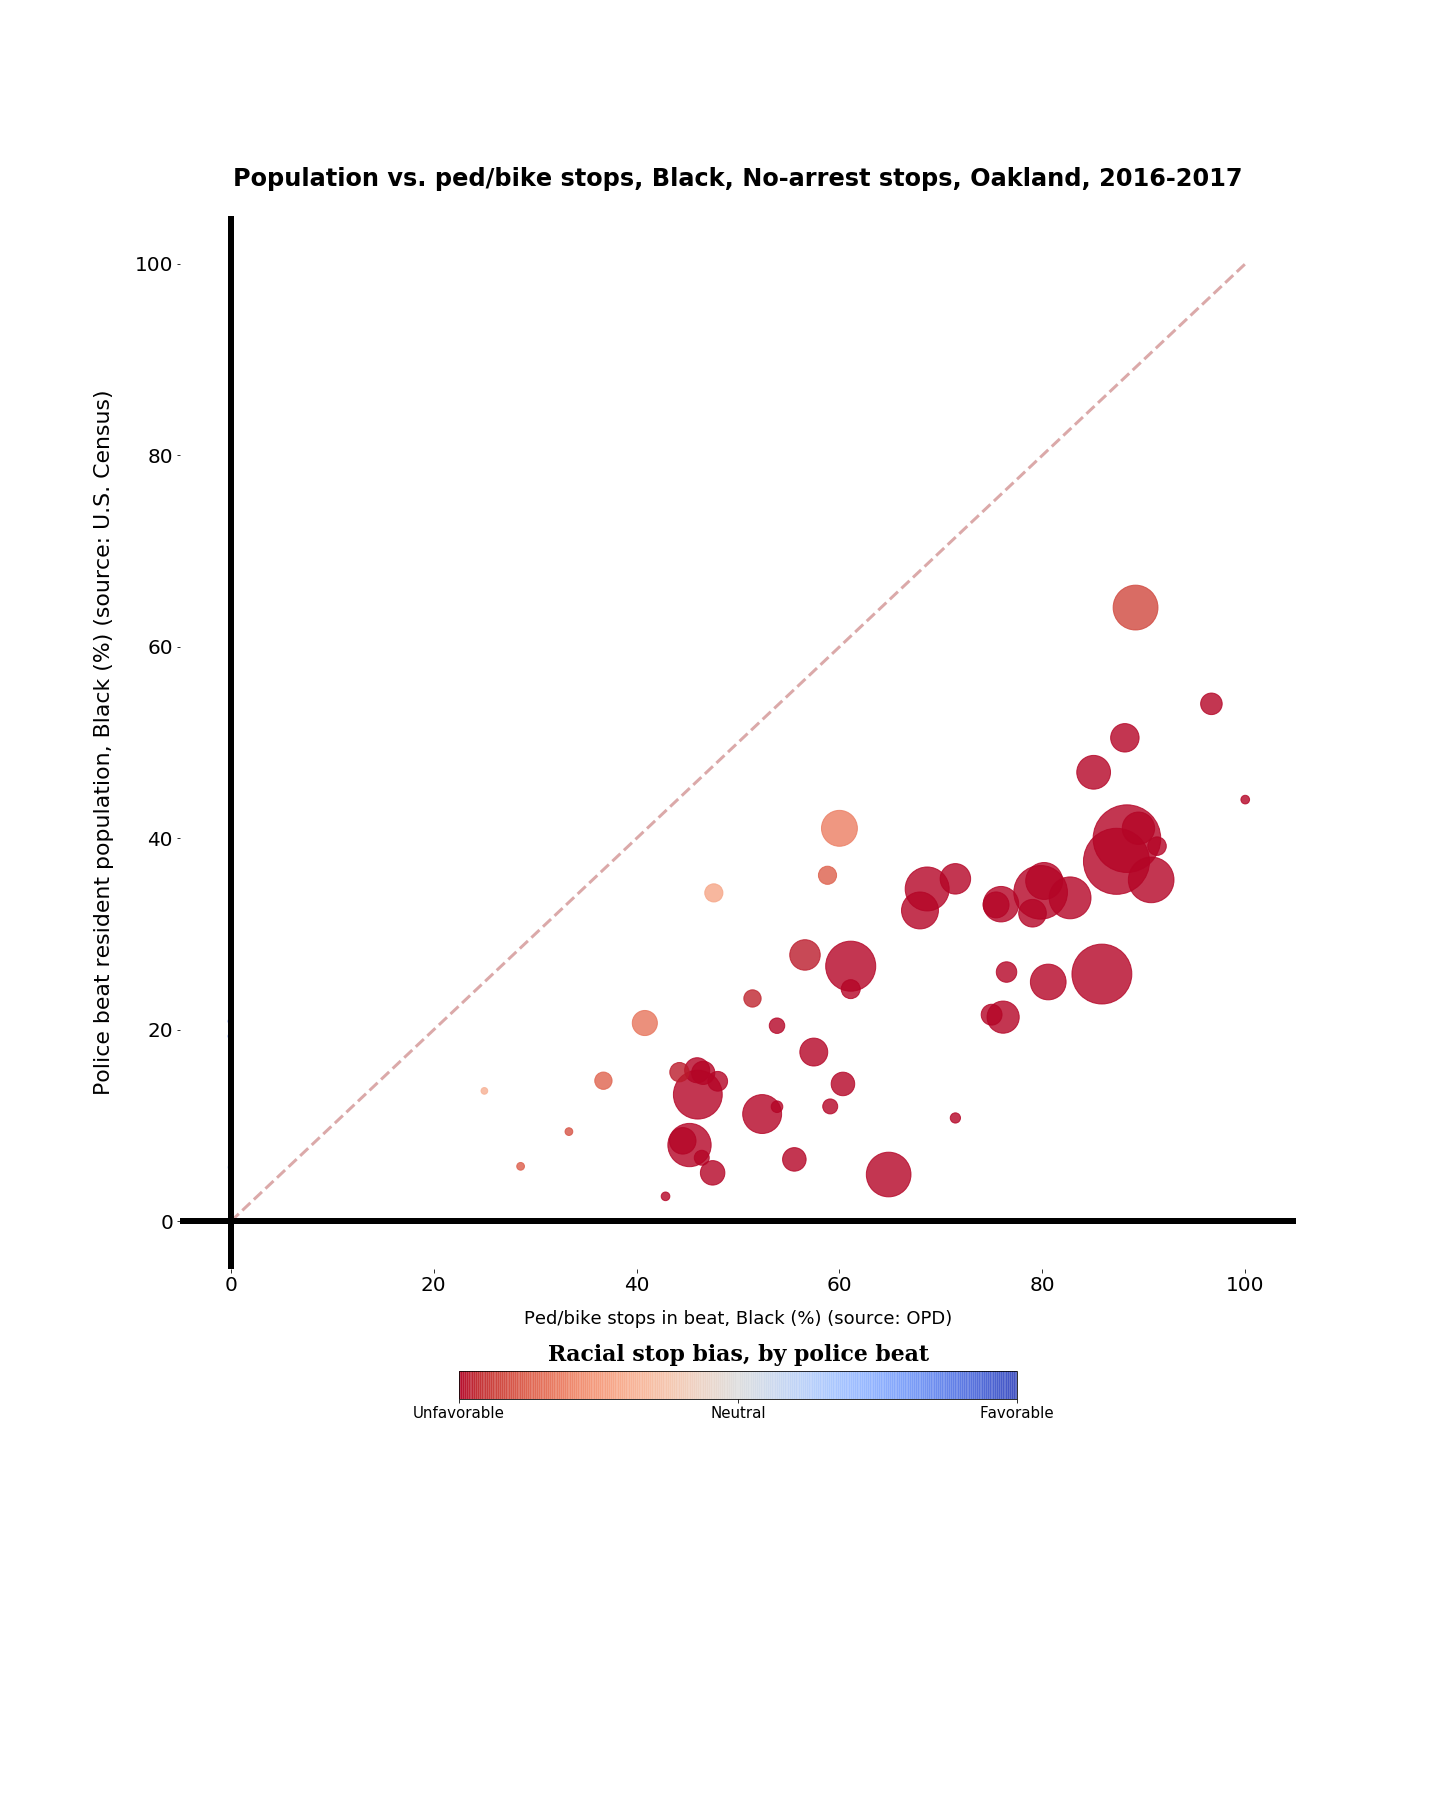
Here again we see that the bias is not spatial, and it’s not close. In every beat in Oakland, looking only at stops which did not result in an arrest, Blacks experienced a disproportionate number of police encounters. City-wide, 68% of no-arrest stops city-wide were of Blacks, the same proportion as arrest stops, which means that Blacks were no more likely to be criminals than others who were stopped. (More on this below).
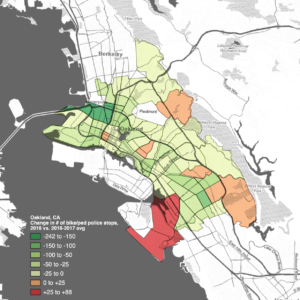
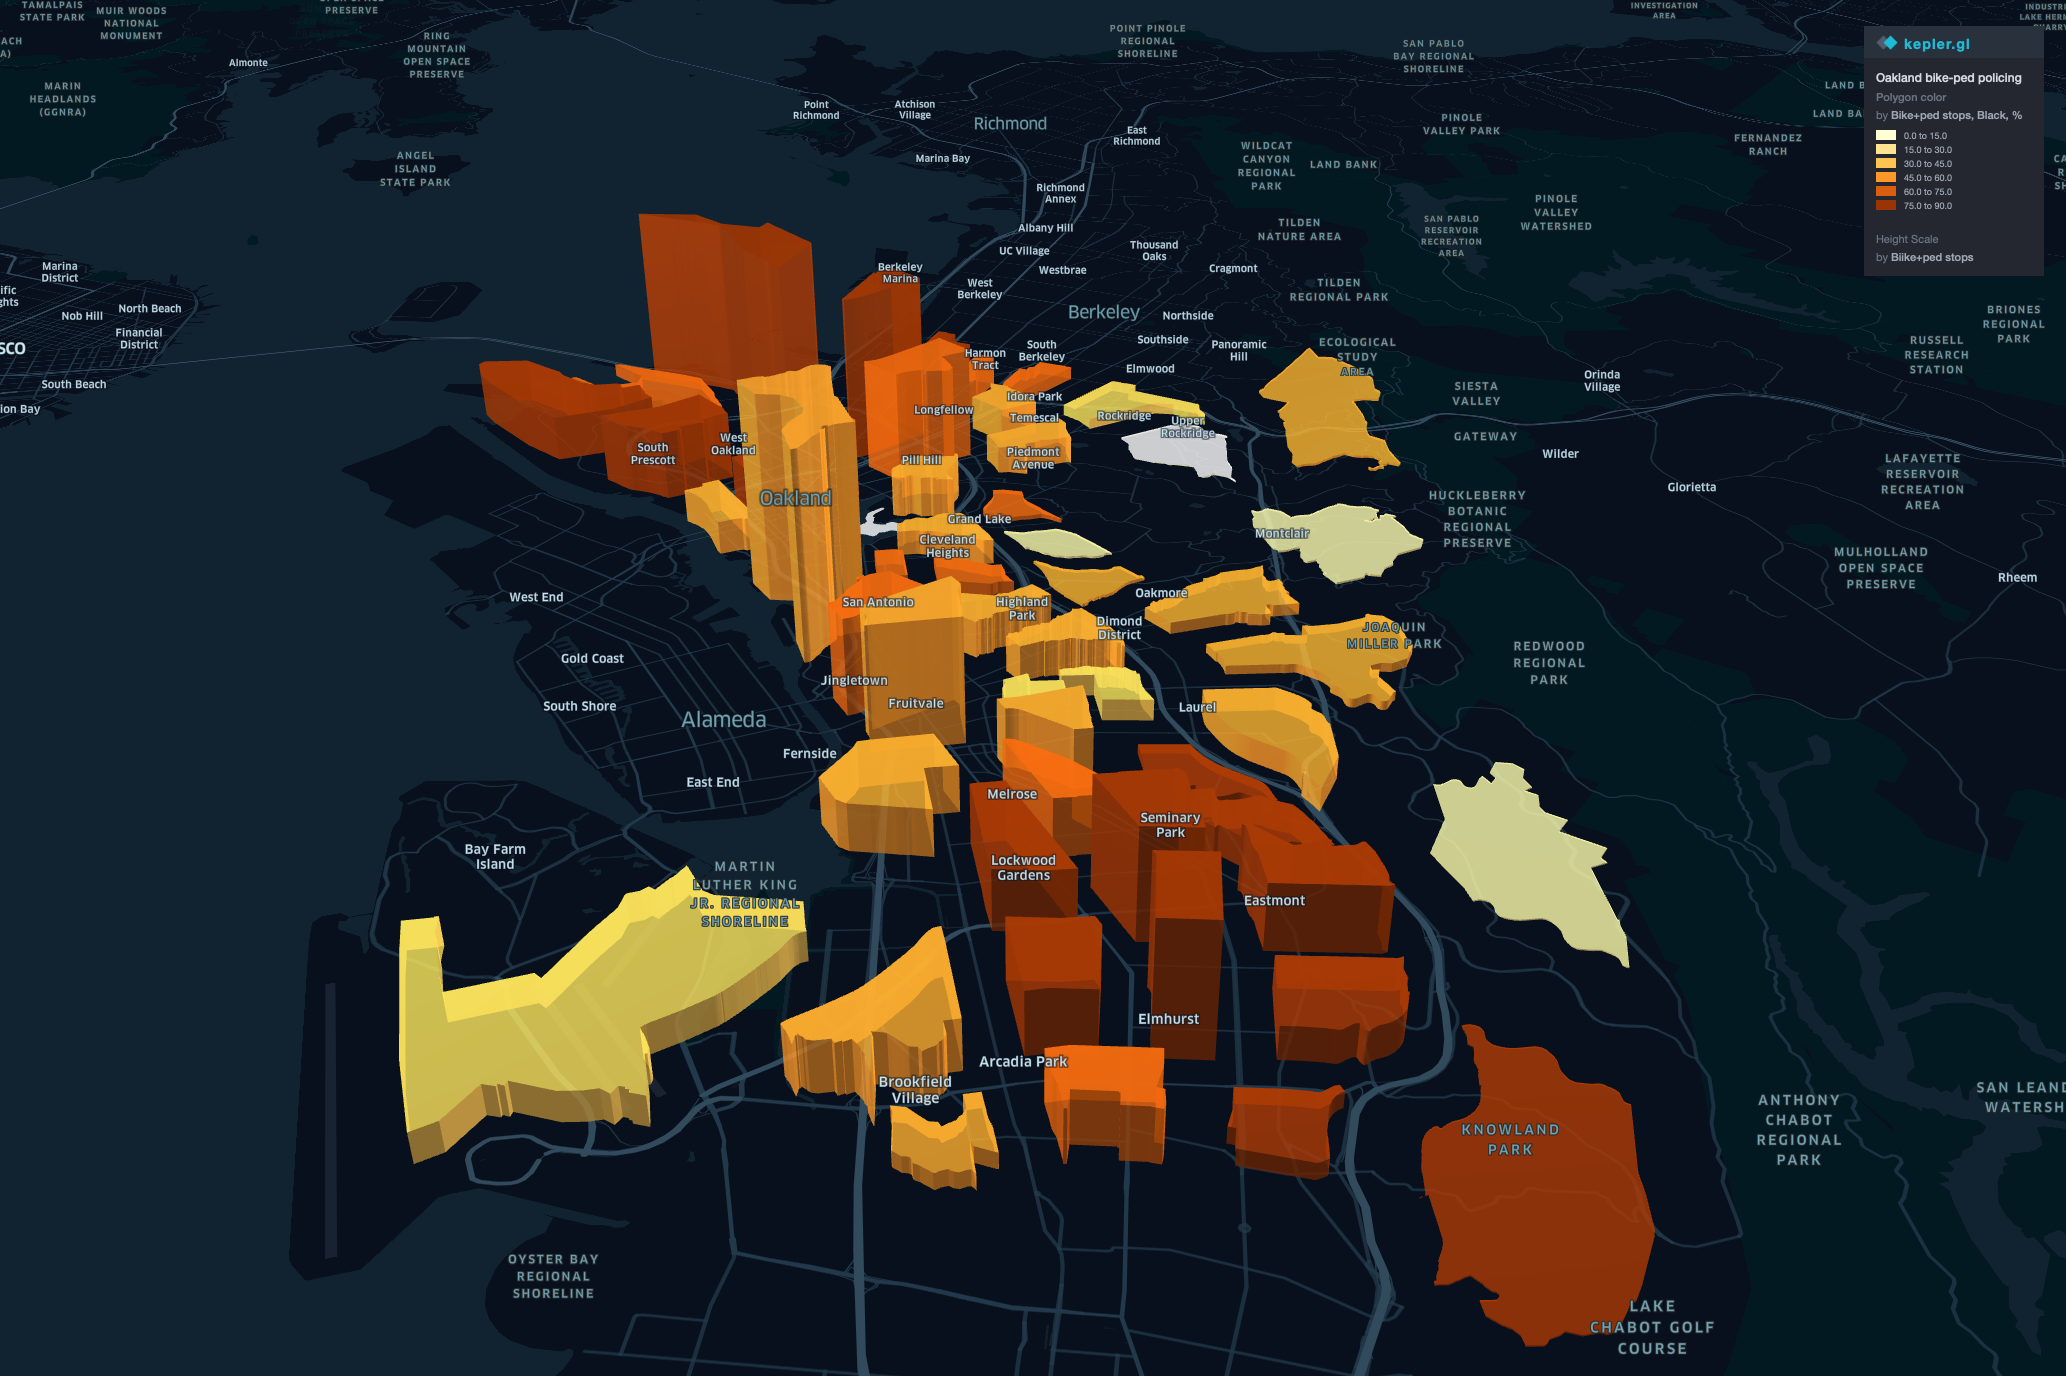
Spatial discussions call out for maps, so here’s a visualization of the data, courtesy of kepler.gl, with the height of the column being the number of stops in the beat, and the coloring being the proportion of Black stops. You can click through to play around with the data by police beat.
Discussion
In his powerful book, “How Racism Takes Place,” George Lipsitz writes about how the racialization of space—segregatory policies such as redlining, housing compacts, and urban renewal—led to a spatialization of race. Governmental policies created Black and White neighborhoods, in Oakland and elsewhere, to the advantage of Whites and the disadvantage of Blacks. Lipsitz:
Since the 1970s, politicians, pundits, and publicists have argued that Black people have shown themselves to be simply unfit for freedom. They argue that in a time when civil rights laws clearly ban discrimination, the persistence of racial inequality demonstrates that Blacks have been unable to take advantage of the opportunities afforded them…What was once done to them by white racists, this line of argument contends, Blacks are now doing to themselves. Inequality between races today, they claim, exists because Blacks allegedly commit more crimes, have lower rates of marriage, and higher rates of children born out of wedlock.
[F]ocusing on Black disadvantages deflects attention away from the unearned advantages that whites possess. It is not so much that Blacks are disadvantaged, but rather that they are taken advantage of by discrimination in employment, education, and housing, by the ways in which the health care system, the criminal justice system, and the banking system skew opportunities and life chances along racial lines. Moral panics about alleged Black misbehavior…are designed to obscure the special privileges that whites receive from collective, cumulative, and continuing forms of discrimination.
A large and unrefuted body of research reveals how the economic standing of millions of white families today stems directly from the unfair gains and unjust enrichments made possible by past and present forms of racial discrimination.
[Phew.]
Lipsitz also notes, as Peggy McIntosh does, that some may acknowledge the disadvantage of Black communities but be much less willing to acknowledge its converse, that Whites have been advantaged by the same systems which produced those disadvantages for Blacks.
We created racialized space, and we use policing to enforce it. In Black neighborhoods, heavy policing led to mass incarceration, breaking bonds and contributing to the ongoing impoverishment of those communities. Elsewhere, Blacks are treated as suspicious outsiders, with policing acting as an invisible fence to keep them out, often at the prompting of residents. BBQ Becky demonstrated how Whites believe that the police exist not only to protect us from crime, but to enforce our vision of spatial order. I’m sure no Black in Oakland would call the police to report a petty quality-of-life violation at Lake Merritt.
Najari was arrested not because he was playing music, but because he had entered racialized space. Downtown Oakland loves to appropriate the aesthetics of Black culture, never more so than on First Fridays, but Blacks who enter that space are expected to conform to White behavioral expectations. Even at a party celebrating music, dance, and art forms sourced from the Black community, Black bodies are viewed with suspicion.
So this policing data looks terrible, but it is even worse than it looks. OPD hasn’t released the 2018 data yet, but when it does, Najari’s case will be included. Beat 04X. 8/3/18. African-American. Male. Bicycle. Misdemeanor Arrest.
Najari did nothing wrong. If I were riding the sound system at Latham Square that night, I would probably not have been stopped, and certainly would not have been arrested. So Blacks are being arrested at the same rate as others in the city, even when they’re not doing anything wrong. So while Blacks represent a hugely disproportionate percentage of police stops, they represent an even greater percentage of specious police stops not related to criminality.
And this is where the Bike Lab comes in. I believe the bicycle is a wonderful tool for comprehending urban geographies. It can break down barriers between communities, and it can also help visualize those barriers. The problem of racially-biased policing isn’t about cycling, but cycling can be used to illuminate the problem. Not everyone has had the experience of participating in a sideshow, but everyone has had the experience of riding a bike. We can understand injustice through that shared lens.
As advocates, we must understand that we are implementing the bike plan in a society with racialized space. We must be exceedingly cautious about enforcement-related recommendations, such as those of Vision Zero, because we know that enforcement will disproportionately impact Blacks. And we must also grapple with the problem of spatial and cultural exclusions. “Bike lanes are white lanes,” not because Blacks don’t ride bikes, but because bike infrastructure is viewed as an extension of racialized space where Blacks are unwelcome.
What would it take to make Oakland’s streets a welcoming space for Blacks? I don’t know the answer, but I’ll tell you now, it won’t look like Copenhagen.
OakDOT did the right thing in empowering the Scraper Bike Team to design a different kind of facility on 90th Avenue; I’m looking forward to seeing it open this year. And that suggests an evaluation criterion for the success of the bike plan: not based on how much infrastructure gets installed, but on how many projects or programs we do which empower and lift up disadvantaged communities. [More on that in a future post].
I got to meet Darlene Flynn (Oakland’s Director of Race and Equity) after her awesome talk at NPC19. She’s a powerful woman who wants to do something about the problem. The bike plan itself will have a relatively light treatment of these issues, but Flynn will be on it, and I’ll do what I can to support her efforts. As should we all.
References
Alta Planning + Design, and Oakland Department of Transportation. “Let’s Bike Oakland.” Oakland Bike Plan Public Draft, City of Oakland, www.letsbikeoakland.com/draft-plan/.
Eberhardt, Jennifer Lynn, ed. Strategies for change: Research initiatives and recommendations to improve police-community relations in Oakland, Calif. Stanford SPARQ, 2016.
Hoffmann, Melody L. Bike lanes are white lanes: Bicycle advocacy and urban planning. U of Nebraska Press, 2016.
Lipsitz, George. How racism takes place. Temple University Press, 2011.
“Oakland Police Department Stop Data.” City of Oakland, City of Oakland, 13 Sept. 2018, www.oaklandca.gov/resources/stop-data.
“Project Jupyter.” Project Jupyter, jupyter.org/.
U.S. Census Bureau (2017) American Community Survey 5-year estimates. Retrieved from https://api.census.gov
 Previous Post
 Next Post