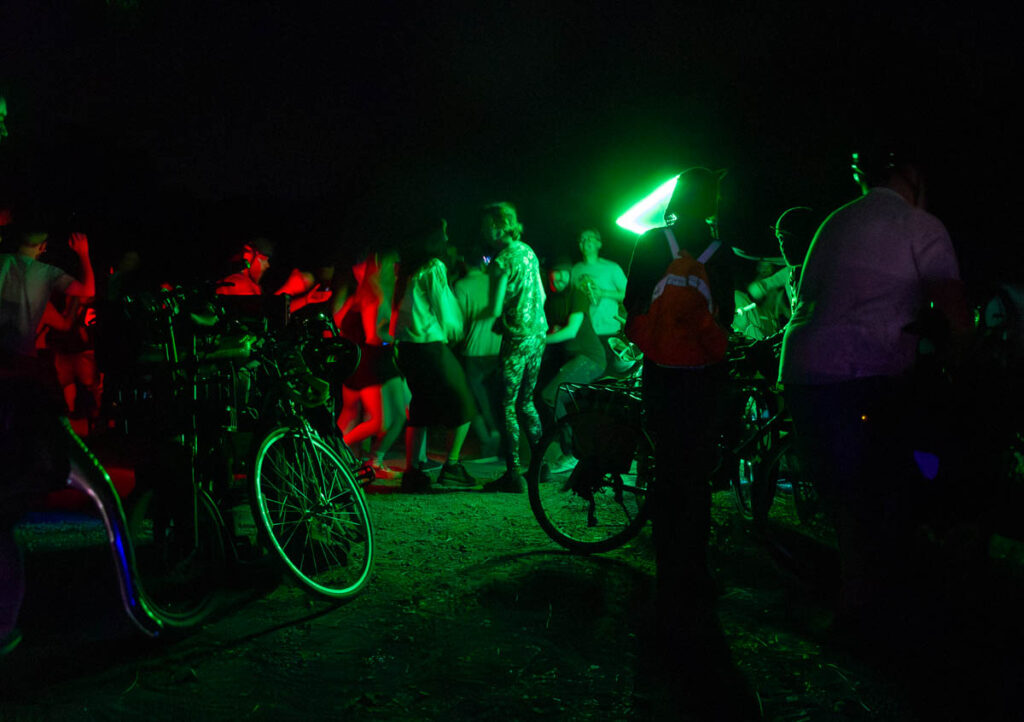
On a rainy day, dozens of bicyclists are standing in one lane of a two-lane commercial street. In the foreground are several people standing with their bikes, wearing yellow safety vests, facing the crowd. One of them has a flag attached to the bike reading, "Cease Fire Now."

The tool you have

The Bike Lab’s premise is that the bicycle can be a tool to understand and fight structural injustice. Bike riders everywhere share the same experience of freedom and mobility, and that shared experience can break down barriers and create new connections across communities. The Gaza Sunbirds sponsored a global solidarity ride in support of aid to Palestine, which created controversy in the East Bay bike community.

Getting it backwards

I had the privilege to accompany Backwards Brian to the Climate Ride Green Fondo. I talked with some of the organizers about their decision to allow him to join after hearing about what happened with AIDS LIfeCycle. To Climate Ride’s credit, they were willing to sit with the discomfort for a while, and eventually let Brian do his thing. Can we foster that kind of inclusion throughout the bike world? I’m pretty sure we’d all benefit.

On the Waterfront

I got into a good rant at Oakland BPAC this month, on the topic of the Transforming Oakland’s Waterfront Neighborhoods (TOWN) project, the city’s attempt to give away millions of dollars in support of the cynical and extractive effort to let a billionaire (A’s owner John Fisher) enrich himself by building 3,000 luxury condos at Howard Terminal. I got annoyed, because the project ignores the East Oakland waterfront neighborhoods which really need infrastructure, but also because it looks like a bad idea on its own merits.

Map of Oakland showing the Metropolitan Transportation Commission's Communities of Concern. Deep East Oakland and parts of downtown and West Oakland are mostly dark purple (Highest concern). A few areas in Deep East, and much of Fruitvale is lighter purple (Higher concern). Most of the rest of the flatlands are light purple (High concern). The hills are uncolored (Low concern).

Compromised

Public-private partnerships require compromises. Compromises on terms are natural in such negotiations, but I am concerned with compromises on principles. There are two ways cities compromise their principles in public-private partnerships: bullshit requirements, and bullshit enforcement.

Group of 20 cyclists riding at night on wide road, with center lane painted orange with colorful wheel graphics. The cyclists are taking the right and center lanes. Lights of cars are seen both approaching and going away.

Scraper Bike Halloween ride

I got to spend Halloween with the Original Scraper Bike Team, and it reminded me of why I enjoy riding with them and supporting them, and also, why it’s important.

Racially-biased policing in Oakland (updated with 2019 data)

The Oakland Police Department is legally required to provide racial data on police stops. But they’re not required to make it easy. But they finally released their report.

We don’t have detailed public data on where the stops are occurring, only the police beat. I did some hacky stuff to estimate the racial composition of each police beat using Census data, and tested whether the stops were proportional to the racial makeup. As you might guess, the answer is “no.” In 2019, the problem was marginally better, but it’s still a problem.

Collection of Chicago (North Lawndale) maps

I’m working on a series of maps of Chicago’s North Lawndale neighborhood. I’m just going to drop a bunch of drafts into this post to share with the team.

Map of Chicago, showing Burgess' concentric-circle zone model on top of the FHA redlining map for Chicago. Nearly all of zone 2 (zone in transition) and zone 3 (zone of workingmen's homes) were redlined. Zone 4 (residential zone) is mostly yellow, and zone 5 (commuters zone) is mostly green and blue.

Burgess concentric circle map in GIS

I’m going to be doing some mapping for a project from Equiticity, and one of the themes will be historical spatial inequities in Chicago. This got me thinking about the highly influential concentric-circle city development map drawn by Ernest Burgess (Chicago School of Urban Sociology) in 1925.

Surprisingly I couldn’t find a usable GIS representation of his drawing. So I decided to work on my georectifying skills and put one together.

You can see how Burgess’ racist ideas led directly to racist housing policies.

Map of Los Angeles County census tracts, colored by percentage of Black population, overlain with Metro Bike Share system coverage.

Assumption of equity

I see advocates assume that the projects that they advocate for will address issues of historical inequities. A thread on distributing bikes in LA led me to investigate whether LA Metro bike share is equitably distributed. Bike share does not reach the Black areas of the city at all; in fact, there’s not a single bike share station located in a census tract that is even 25% Black.

Map of Oakland with existing, pending, and proposed Slow Streets highlighted. Four streets are marked as "Completed April 11", four more are "Pending Installation April 17", and approximately 20 more scatters around the city are "Other Streets to be Evaluated"

As I was saying…

I’d been working on my post about disproportionate impact since before COVID-19 hit the Bay Area, but it happened to land in the middle of a broad conversation about the disproportionate impact of the pandemic on poor and working-class BIPOC, and the opening of Oakland’s opportunistic Slow Streets program, which streets advocates across the country are now demanding their cities emulate.

Last night Oakland held its weekly COVID-19 town hall; the segment led by Warren Logan, Libby Schaaf’s Director of Mobility and Interagency Relations, really made the point about how we’re equity-washing streets programs.

Map of Oakland showing median income. All of East Oakland is shaded in red (less than $50K) or orange ($50-$100K). The hills to the north are in blue (>$200K) , while the areas further east and south trend to green and yellow ($100-$200K)

Disproportionality

I keep encountering a trope about how poor people of color are disproportionately impacted by the societal harms related to the topic the author is writing on. Whether it be pollution, housing insecurity, food insecurity, or health issues like asthma, diabetes, and now COVID-19, low-income BIPOC have it worse than anyone else. The trope goes further, to employ the fact of disproportionate disadvantage as a justification for the author’s favored project: a bike lane, or a housing development, or a park or an urban farm or whatever it is the writer thinks is important.

I will note that it’s generally true. BIPOC have been disadvantaged in America since Columbus first showed up, and the effects are still seen throughout out society.

But the problem with disproportionate impact—besides its existence and its effects on BIPOC—is that its very ubiquity limits its usefulness as a tool for policy analysis.

East Oakland and resilience

On Tuesday I did my Tour of Oakland bike ride, and one of the impressions I came away with is that East Oakland, especially Deep East, has been less affected by the shelter-in-place order than the rest of the city. Much of the economy of East Oakland is informal, so shutting down the formal economy doesn’t hit the neighborhood as hard. I saw a few of the Scraper Bike Team kids out, too.

Displacement and density

After doing some crunching this week on data about rapidly-gentrifying Valencia Street in San Francisco, and finding that residential density is actually dropping in the neighborhood despite new housing construction, I wondered whether the same phenomenon could be found elsewhere in the country. I didn’t have to wait long for another case study, as Lynda Lopez and a number of other peeps I follow from Chicago posted about Mayor Lori Lightfoot’s ill-considered statement about “vibrancy” in Pilsen, a gentrifying neighborhood west of the Loop. It turns out that the demographic dynamics in Pilsen are very similar to Valencia Street, and they challenge the claim that infill development is a climate solution.

Two maps of Valencia Street in San Francisco, showing a large increase in median household income from 2000-2018, and a sizable decrease in Hispanic population.

Bike infrastructure and displacement

I have been really, really trying to avoid getting into the housing debate. But transportation and housing are inextricably linked, and my investigation of bike infrastructure’s relationship to gentrification is part of the Bike Lab’s work. A Twitter thread sparked by Phil Matier’s terrible SF Chronicle article led me to do some data analysis of Valencia Street’s transformation. Some of the results are pretty staggering.

Map of San Francisco showing Golden Gate Park and a selected census tract (67000) in the Outer Sunset

Error bar

Phil Matier is a terrible journalist. One of the ways in which he’s terrible is that he doesn’t understand statistics at all, or at least, the way he uses statistics in his writing is uninformed (at best) or intentionally misleading (at worst). I’ll be charitable and assume that the fallacies in his work come from a place of ignorance rather than deception.

The Douchebag Problem

As an urban critical theorist studying cycling cultures and neighborhood change, I’ve long been curious about the correlation between the terms “fixie” and “douchebag.” My working definition is that douchiness is where entitlement meets cluelessness. The douchebag is a privileged person who feels entitled to that spot at the bar, that condo in the city, that job in tech, and that private bus to work which makes it all possible. And he is clueless about how his entitlement to those things pushes others out of the way.

Top down

I’ve been thinking about how cycling and skateboarding cultures are different, and I have the impression skating has never embraced top-down hierarchy in the same way bike advocacy has. Reading Peter Flax’s interview with Effective Cycling founder John Forester, I realized that Forester is just as concerned with being at the top of the hierarchy as traditional bike advocates; he just disagrees about how to get there.

3-D map of Oakland police beats with colors showing percentage of Black stops of bikes and pedestrians in each beat, with height showing the number of stops in the beat. Highest bars are in Fruitvale, most black in West and East Oakland

Racially-biased policing in Oakland (updated with 2018 data)

Rachel Swan (SF Chronicle) recently published a story about police bias in Oakland, including newly-available data from 2018. Overall, OPD stopped a lot fewer people in 2018, but even after accounting for that, the number of Blacks stopped dropped more than other groups. Eberhardt suggests that the reduction in stops represents a move towards “intelligence-led” policing. I don’t see how the data supports her assertion. In 2018, 31% of all the stops are listed as “IntelligenceLed”, while in 2016-2017 that number was 29%; a small change, certainly not enough to account for a 30%+ drop in the total number of stops.

Looked at on a beat-by-beat basis, you can see that the reduction in stops was broad across the city, but the biggest drops came from West and Deep East Oakland.

Richmond Bridge bike path opening

The big event this weekend was the opening of the Richmond Bridge bike path. Najari killed it with his remarks at the ribbon-cutting, and I enjoyed the path more than I expected to. A lot of that was the energy of the event, where there were at least 1,000 cyclists. The few times where I was riding more or less solo, the isolation and noise of the bridge felt a bit oppressive; I think on an average day noise and smell will be real issues. But it’s better than another car lane.

Chart showing fatal crashes in Vision Zero cities from 2011-2018, gradually rising about 20%.

Revisiting a bad idea

My posts earlier this year suggesting that Vision Zero’s communications strategy of amplifying safety risks might be counter-productive received a little bit of attention. I wanted to revisit the analysis to include the 2018 data from both the ACS and FARS, and to address some methodological criticisms.

Scroll to Top