
Field Work
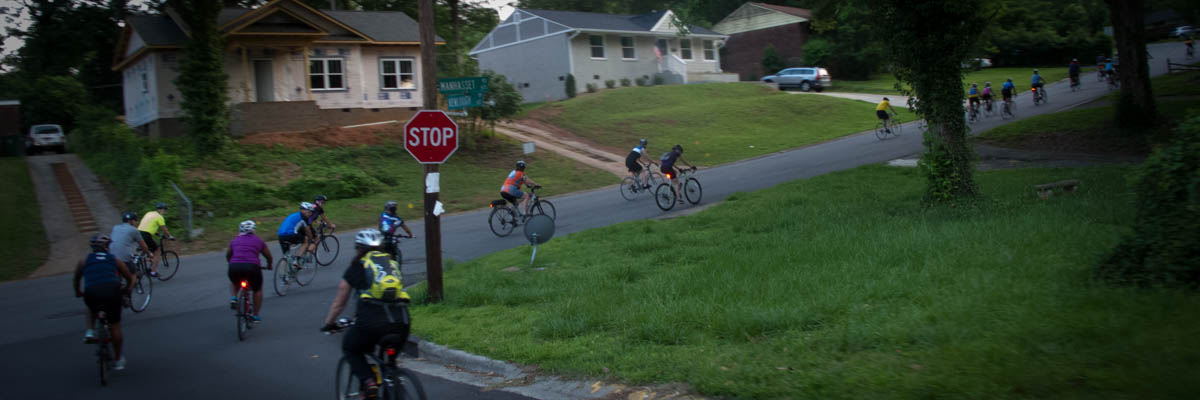
My thesis field work involved visiting four U.S. cities, selected because of broadly similar demographic characteristics combined with substantially different cycling rates. I met with city officials and bike communities in each city, observing how the use of the bicycle manifested differently in different places.
Population: 912,791
Median income: $56,351
Median age: 32
Density: 3520/sq. mi.
White: 49.7%
Black: 7.2%
Hispanic: 34.0%
Asian: 6.1%
Population: 809,958
Median income: $51,034
Median age: 33.3
Density: 3273/sq. mi.
White: 42.9%
Black: 35.2%
Hispanic: 13.9%
Asian: 5.4%
Population: 835,957
Median income: $44,426
Median age: 32.3
Density: 3976/sq. mi.
White: 58.4%
Black: 26.9%
Hispanic: 6.1%
Asian: 4.5%
Population: 407,207
Median income: $50,573
Median age: 32.1
Density: 7418/sq. mi.
White: 60.0%
Black: 17.9%
Hispanic: 9.7%
Asian: 6.2%