
Collection of Chicago (North Lawndale) maps
I’m working on a series of maps of Chicago’s North Lawndale neighborhood. I’m just going to drop a bunch of drafts into this post to share with the team.
I’m working on a series of maps of Chicago’s North Lawndale neighborhood. I’m just going to drop a bunch of drafts into this post to share with the team.
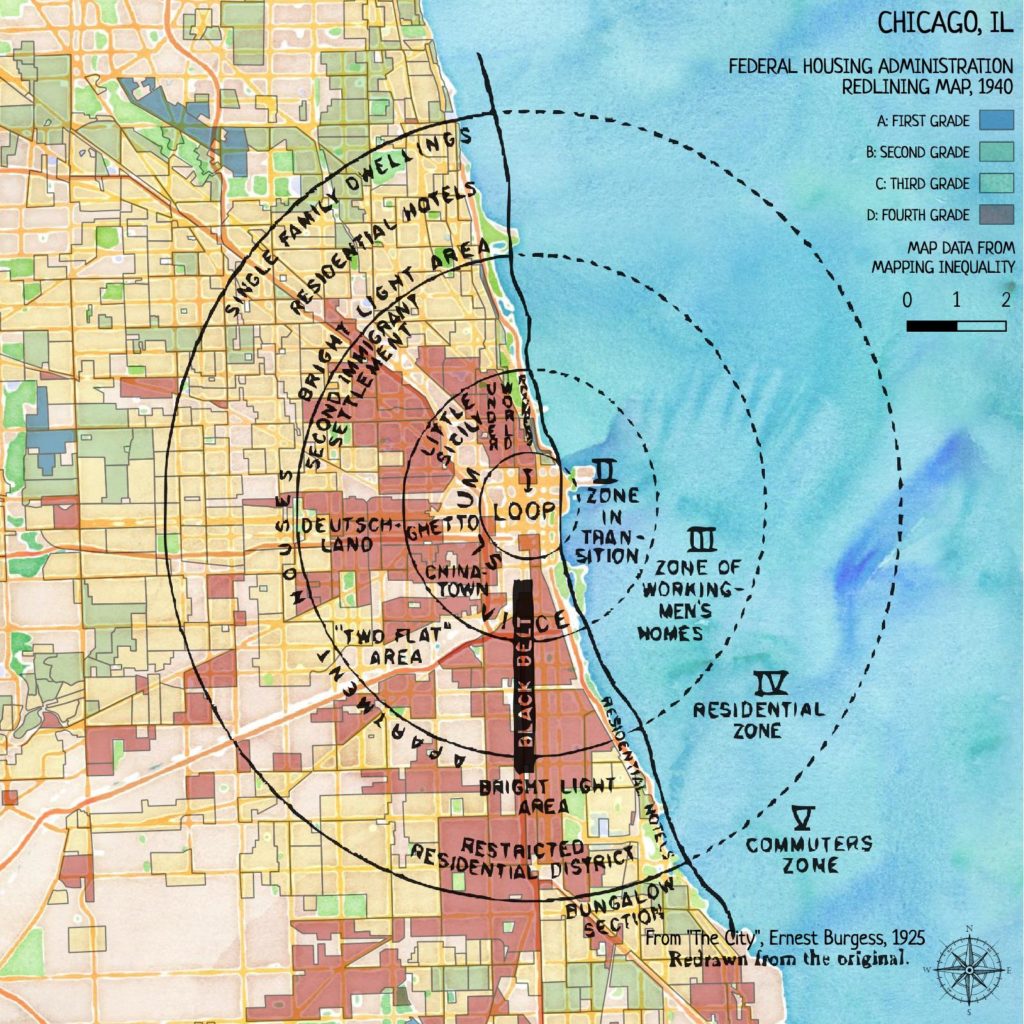
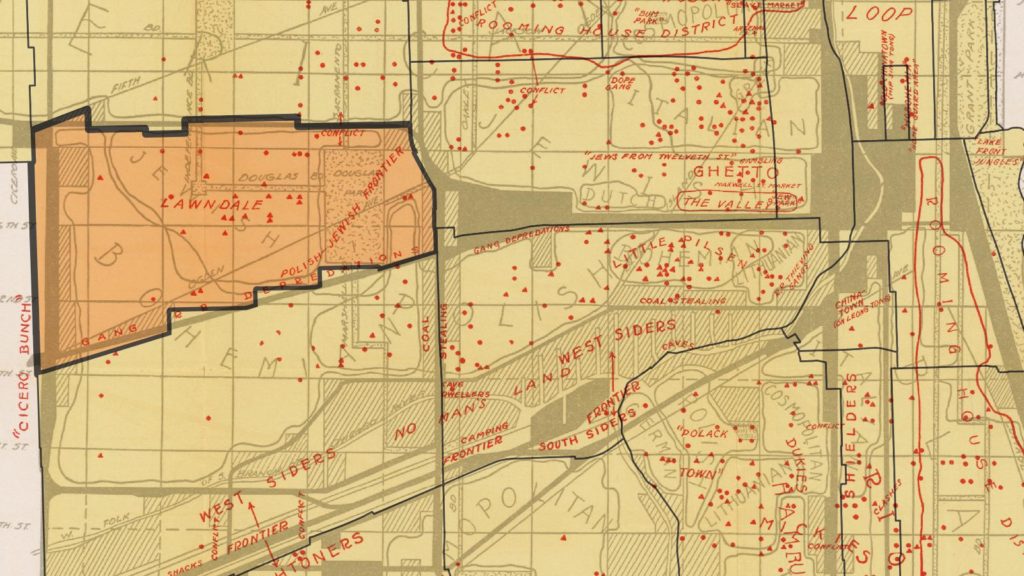
I’m going to be doing some mapping for a project from Equiticity, and one of the themes will be historical spatial inequities in Chicago. This got me thinking about the highly influential concentric-circle city development map drawn by Ernest Burgess (Chicago School of Urban Sociology) in 1925.
Surprisingly I couldn’t find a usable GIS representation of his drawing. So I decided to work on my georectifying skills and put one together.
You can see how Burgess’ racist ideas led directly to racist housing policies.
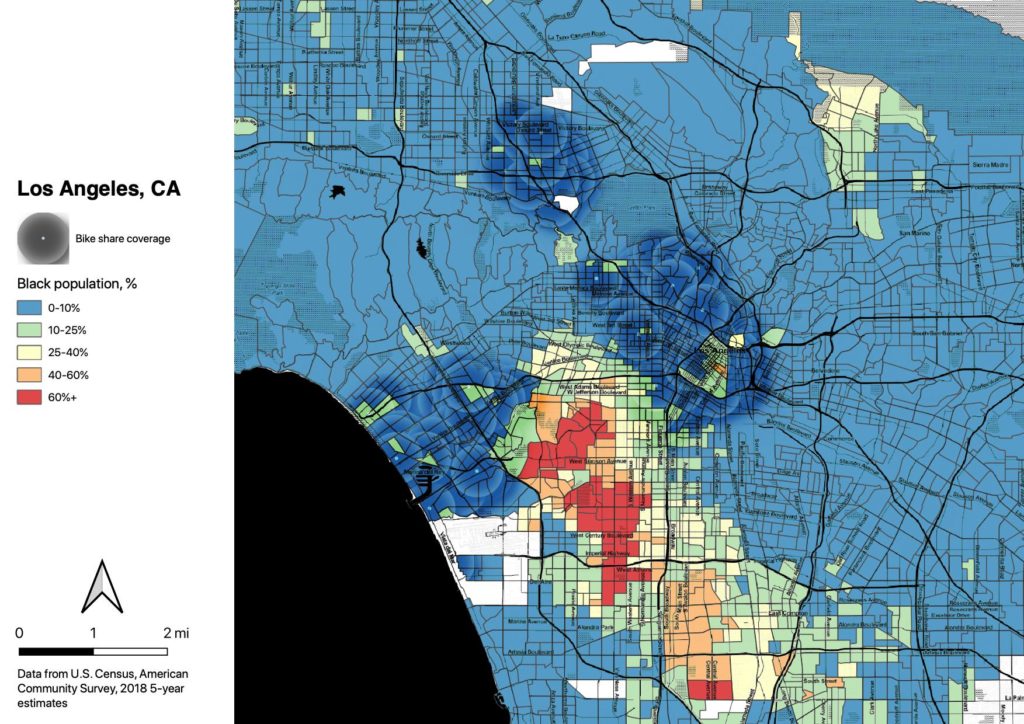
I see advocates assume that the projects that they advocate for will address issues of historical inequities. A thread on distributing bikes in LA led me to investigate whether LA Metro bike share is equitably distributed. Bike share does not reach the Black areas of the city at all; in fact, there’s not a single bike share station located in a census tract that is even 25% Black.
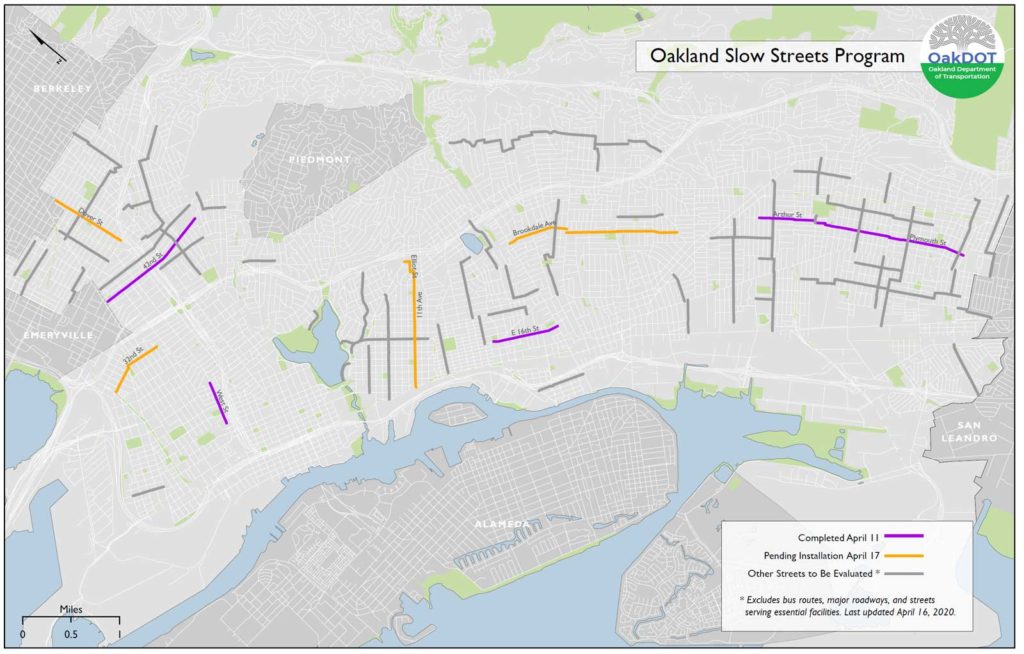
I’d been working on my post about disproportionate impact since before COVID-19 hit the Bay Area, but it happened to land in the middle of a broad conversation about the disproportionate impact of the pandemic on poor and working-class BIPOC, and the opening of Oakland’s opportunistic Slow Streets program, which streets advocates across the country are now demanding their cities emulate.
Last night Oakland held its weekly COVID-19 town hall; the segment led by Warren Logan, Libby Schaaf’s Director of Mobility and Interagency Relations, really made the point about how we’re equity-washing streets programs.
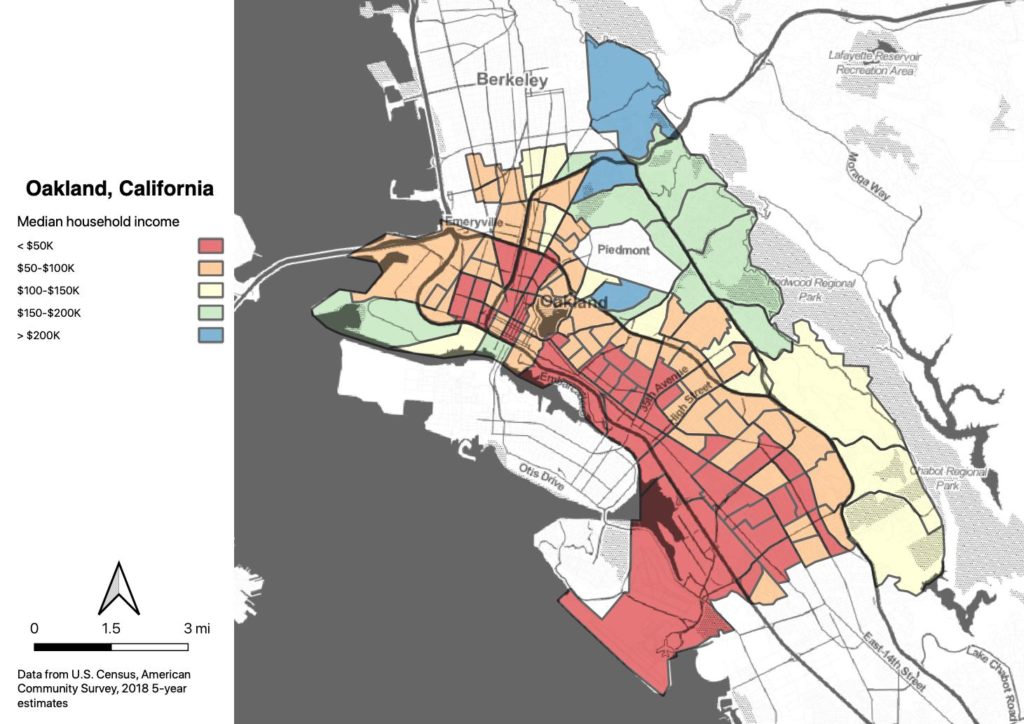
I keep encountering a trope about how poor people of color are disproportionately impacted by the societal harms related to the topic the author is writing on. Whether it be pollution, housing insecurity, food insecurity, or health issues like asthma, diabetes, and now COVID-19, low-income BIPOC have it worse than anyone else. The trope goes further, to employ the fact of disproportionate disadvantage as a justification for the author’s favored project: a bike lane, or a housing development, or a park or an urban farm or whatever it is the writer thinks is important.
I will note that it’s generally true. BIPOC have been disadvantaged in America since Columbus first showed up, and the effects are still seen throughout out society.
But the problem with disproportionate impact—besides its existence and its effects on BIPOC—is that its very ubiquity limits its usefulness as a tool for policy analysis.
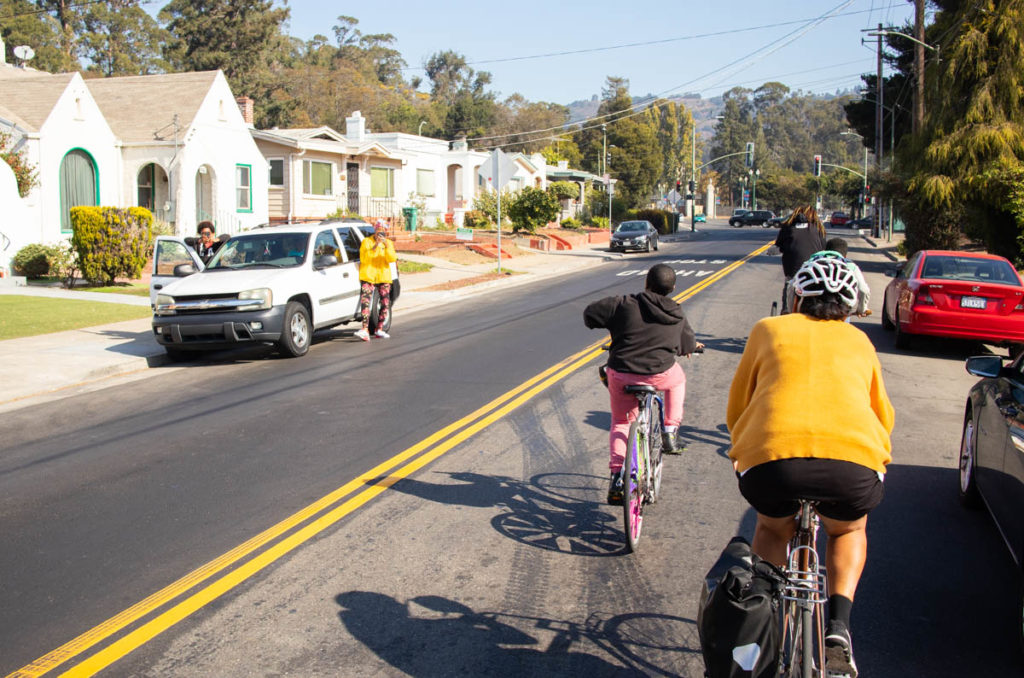
On Tuesday I did my Tour of Oakland bike ride, and one of the impressions I came away with is that East Oakland, especially Deep East, has been less affected by the shelter-in-place order than the rest of the city. Much of the economy of East Oakland is informal, so shutting down the formal economy doesn’t hit the neighborhood as hard. I saw a few of the Scraper Bike Team kids out, too.