Bike!Bike! West 2026
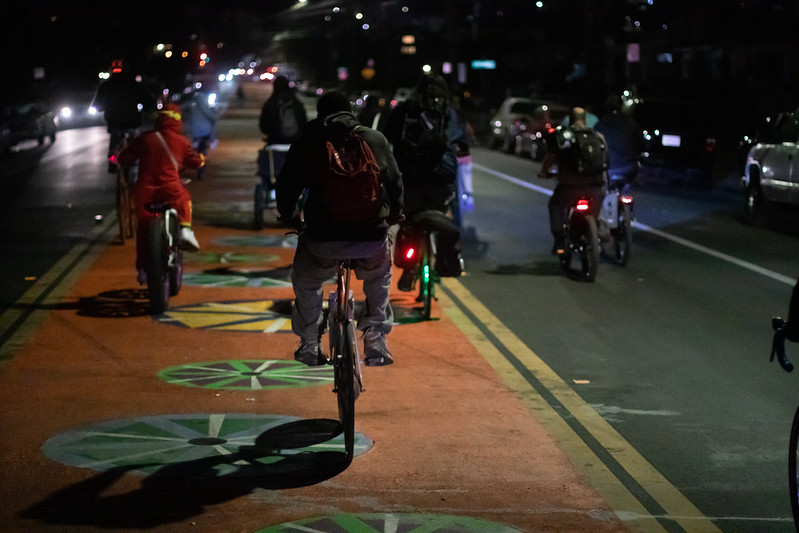
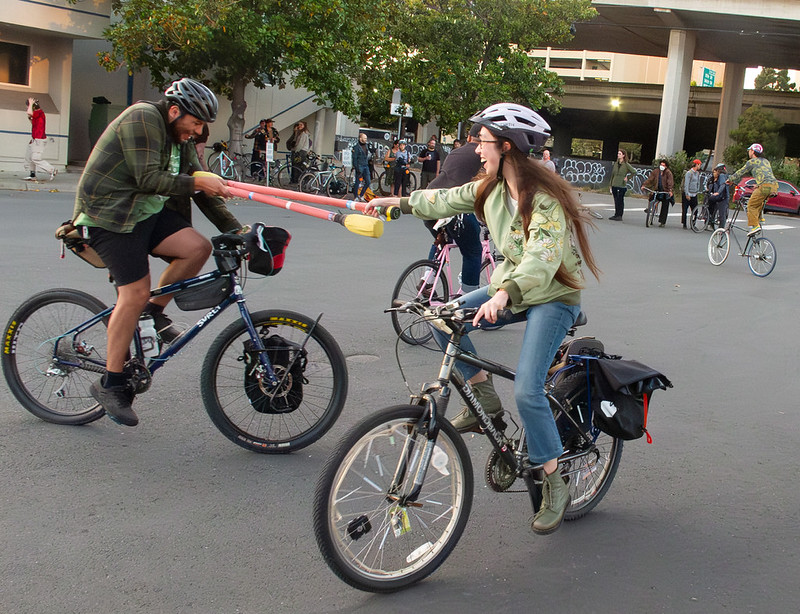
I had the pleasure of participating in Bike!Bike! West 2026, a conference of community-based and co-op bike organizations that I’d been unaware of until my friend and colleague July decided to take on the daunting task of putting on a multi-day anarchistic event here in Oakland.