The Oakland Police Department is legally required to provide racial data on police stops. But they’re not required to make it easy. Robert Prinz (Bike East Bay) has had a public record request on file for OPD’s 2019 policing data for months, and they never responded to him. But they finally released their report, just in time for us to make a 2020 public records request.
Robert’s been working on this topic for some time; here’s his thread on the 2019 release.
I went to grab the raw data to check on how things are going relative to 2016-2017 and the 2018 update. Short answer: It’s still bad, but marginally less bad than it was.
Background
Back in 2014, the City of Oakland contracted with Jennifer Eberhardt’s SPARQ group to do data analysis on police stops in Oakland. Their report found numerous racial biases in stops and treatment of detainees, but it did not break out bike and pedestrian stops from vehicle stops. Robert’s work started to dig into what was happening for cyclists, which turned out to be about equally bad as it was for drivers.
OPD’s response was that the stops weren’t racially biased but were instead spatially biased based on policing needs. Black people were being stopped, this argument suggests, because OPD was doing stops in East and West Oakland, because that’s where the crime was occurring. More Black people were being stopped because East and West Oakland are disproportionately Black. Just coincidental.
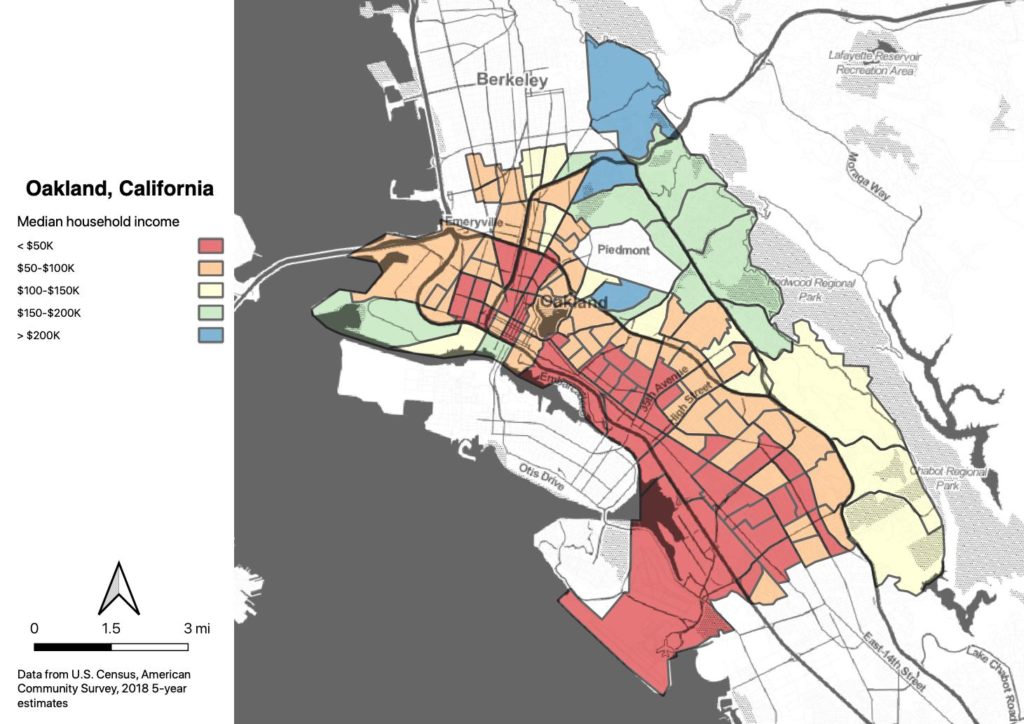
We don’t have detailed public data on where the stops are occurring, only the police beat. I did some hacky stuff to estimate the racial composition of each police beat using Census data, and tested whether the stops were proportional to the racial makeup. As you might guess, the answer is “no.”
Data analysis
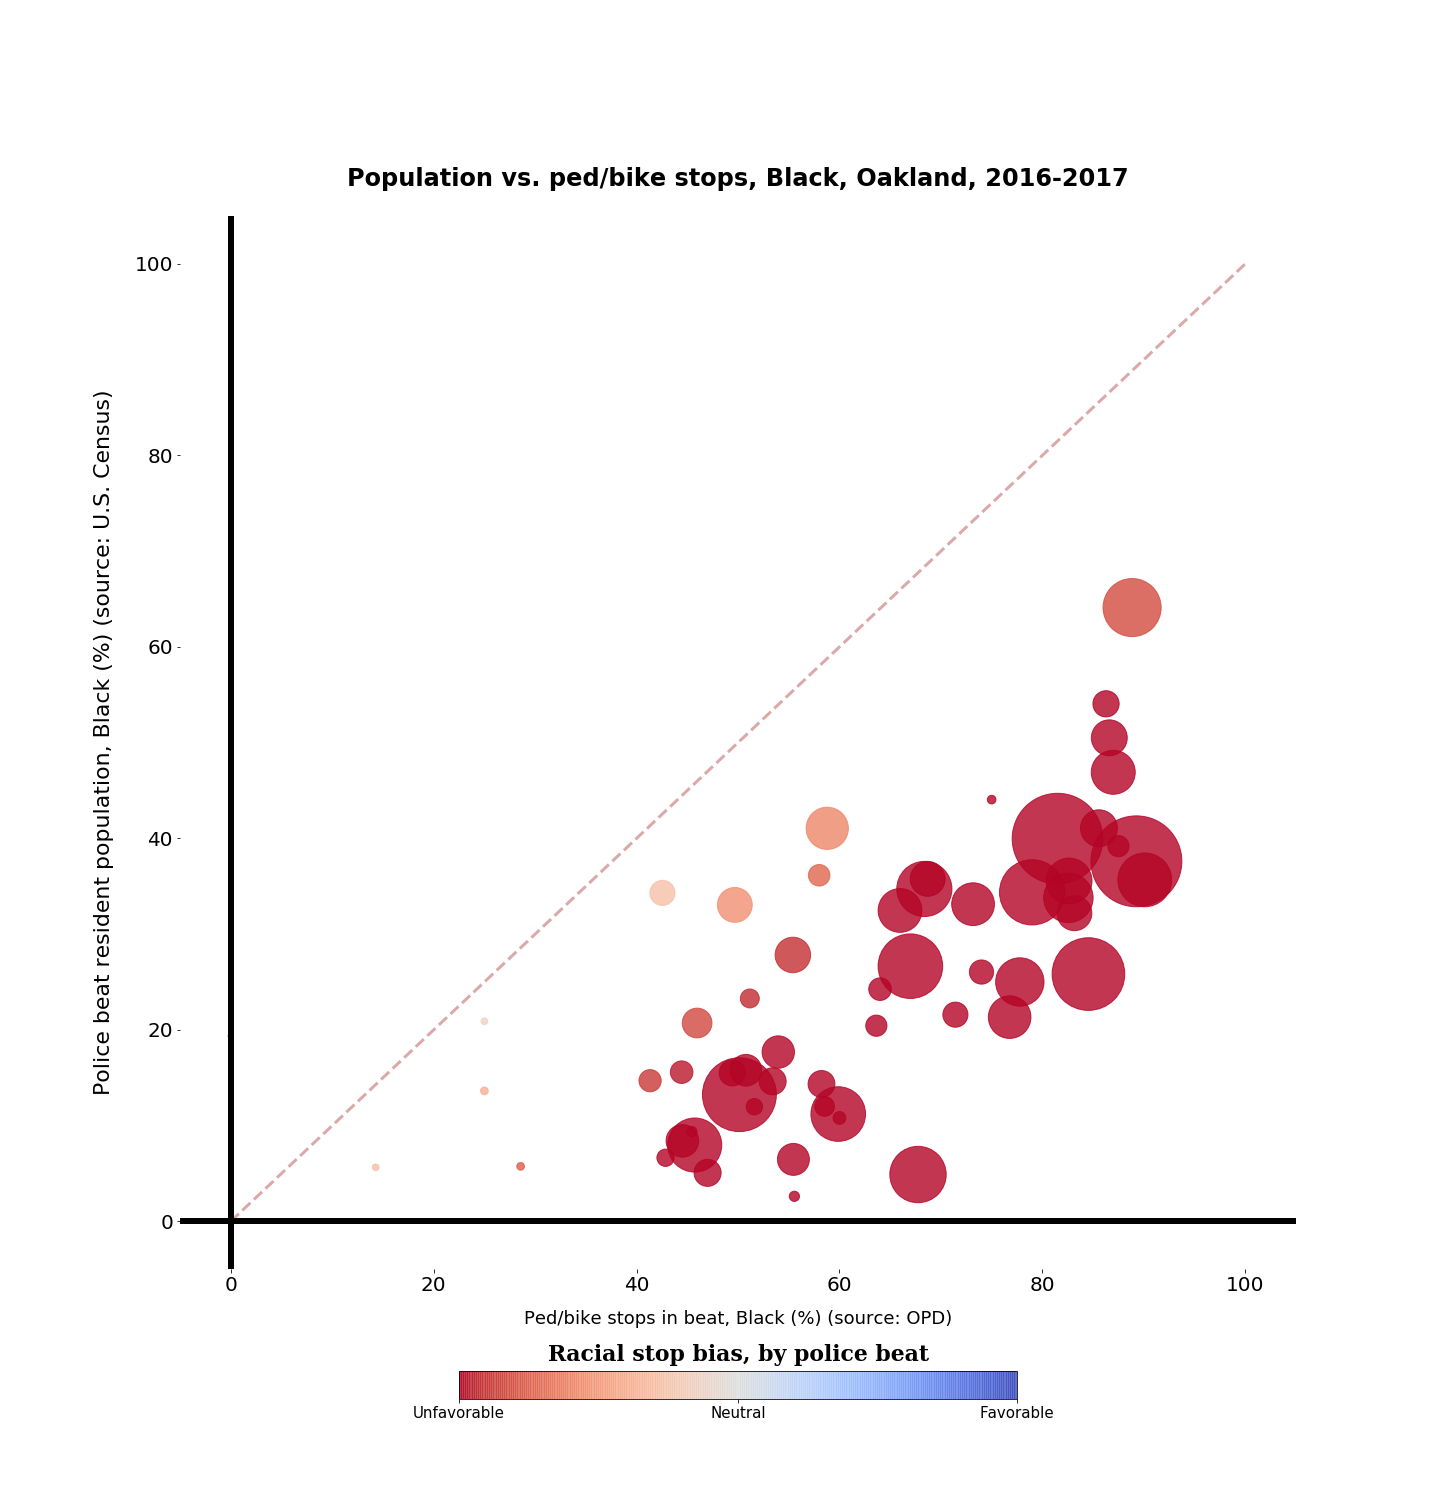
Below is the chart based on the the 2016-2017 data. The dotted line is what unbiased stops would look like: the percentage of stops of Black people in the beat would be the same as the percentage of Black people in the beat. This was true in no beat in Oakland. Size of the dot is proportional to the number of stops in the beat.
Here’s the same chart for the 2019 data.
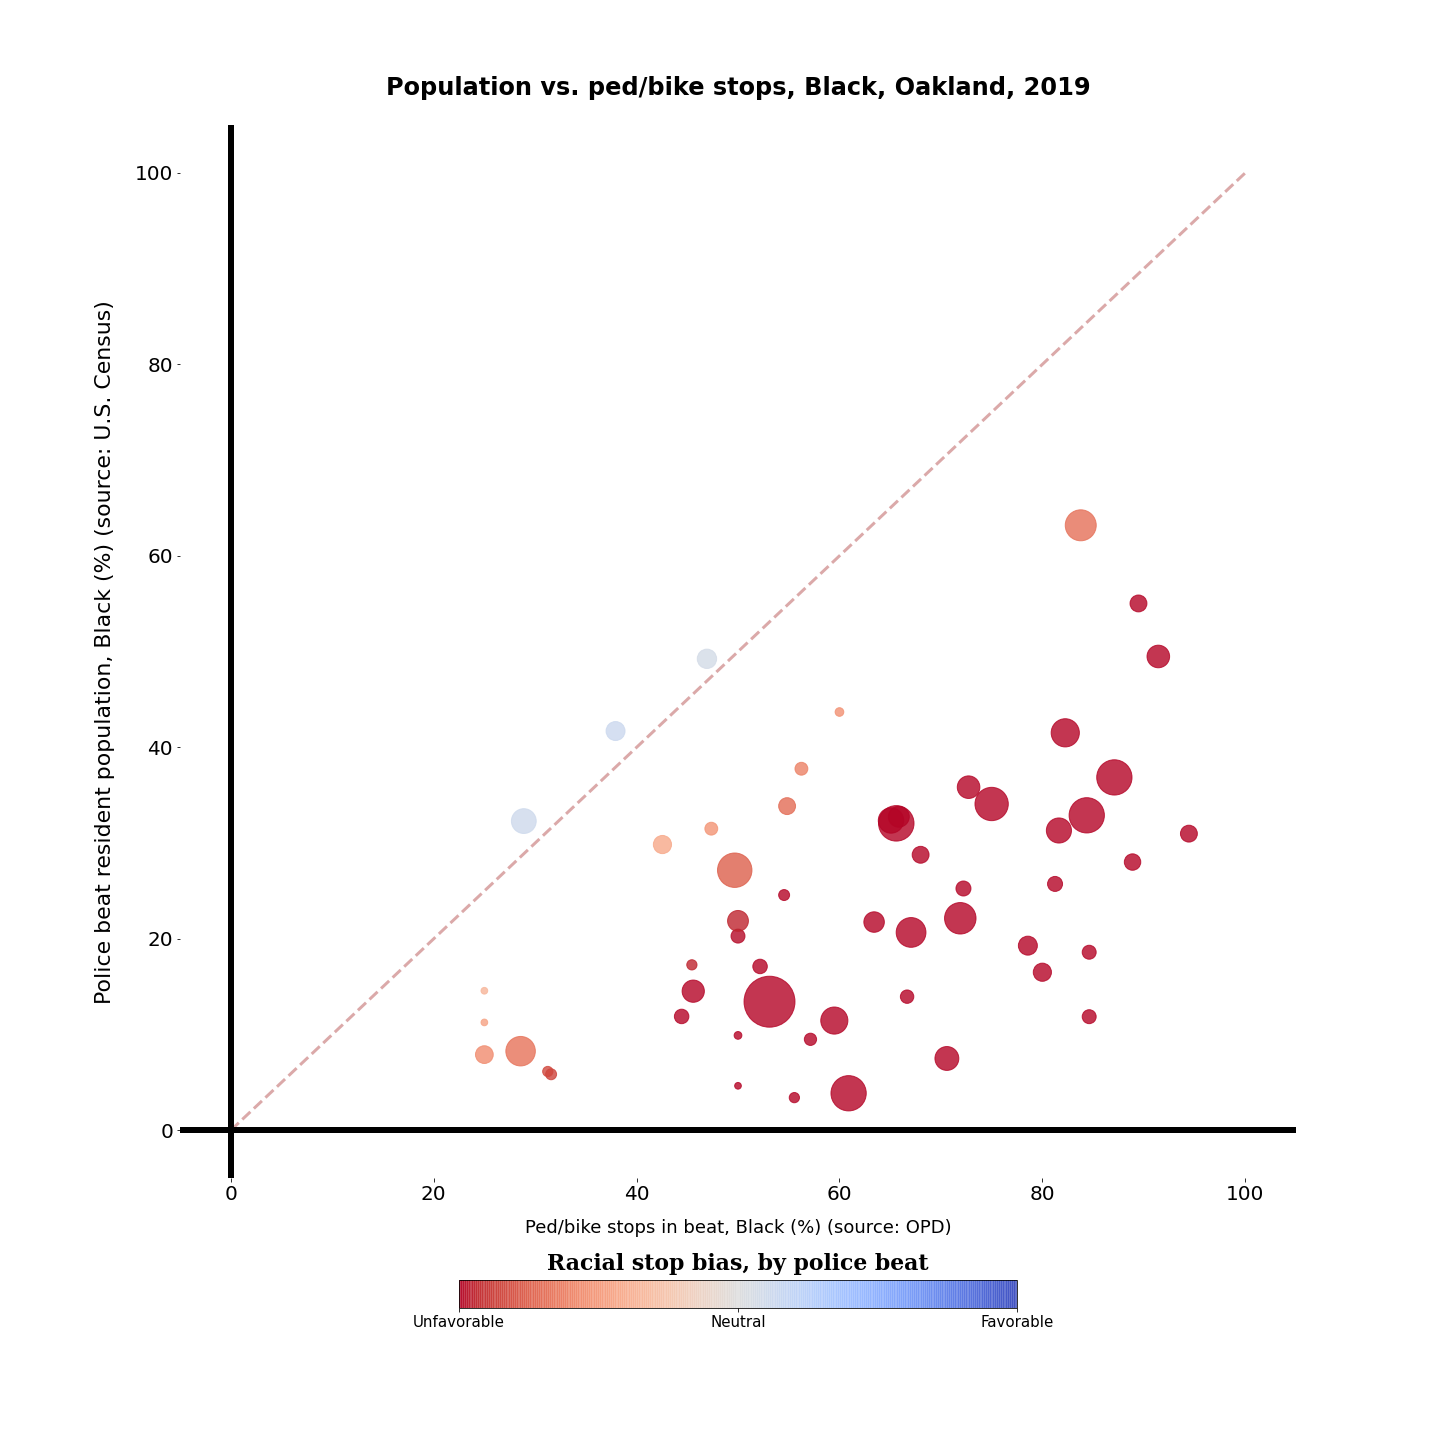
There are two things going on here. One is that the total number of stops has declined. (The scale of the dot size is the same for both charts). OPD supposedly made a change during 2018 to avoid stopping bikes and pedestrians as part of traffic enforcement, and it appears to have had an effect. According to this data, the total number of bike+ped stops in 2019 is almost 40% lower than the 2016-2017 average. That results in smaller dot sizes in the chart (and on the street, fewer problems with biased policing).
The other thing that’s happening is that the bias against Black people in police stops has improved, a little bit. There are actually three police beats where the number of Black people stopped is proportional to the number of Black people who live there, which was not true in 2016-2017. A few of the other dots have moved closer to the no-bias line. But in most of the city it’s still pretty bad. In total, Black people make up 58.6% of Oakland’s bike and pedestrian stop population, down from 68.1% in 2016-2017. Black people make up less than 25% of Oakland’s population, so the bias is still pretty substantial.
It’s interesting to look at where the changes in stop frequency are occurring. Another chart:
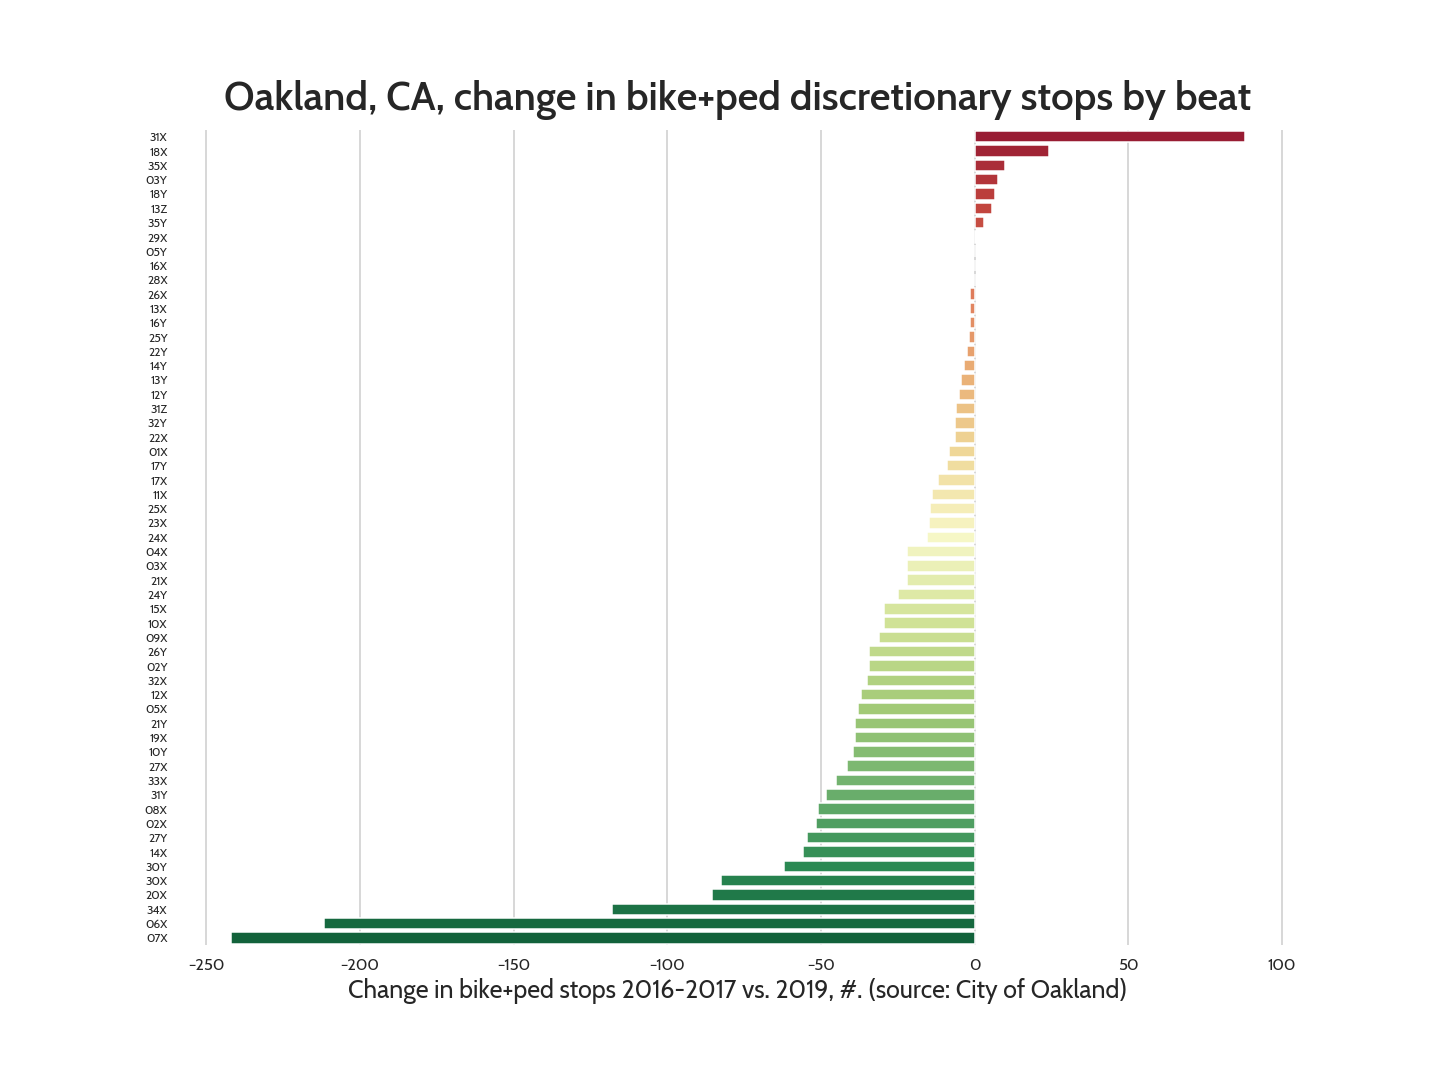
There were fewer stops in most Oakland police beats, but the bulk of the decline came in just two beats, 06X and 07X. Those cover the northern part of West Oakland (McClymonds/Hoover-Foster/Longfellow) , which is one of the most rapidly gentrifying areas of Oakland. On the other hand, some of the beats in Deep East Oakland (31X, 18X, 35X) saw more police stops.
One beat in Deep East saw a substantial decline in stops: beat 34X, which happens to be where the Scraper Bikeway is. Here’s what it looks like spatially; 34X is the greenest box in the bottom right.
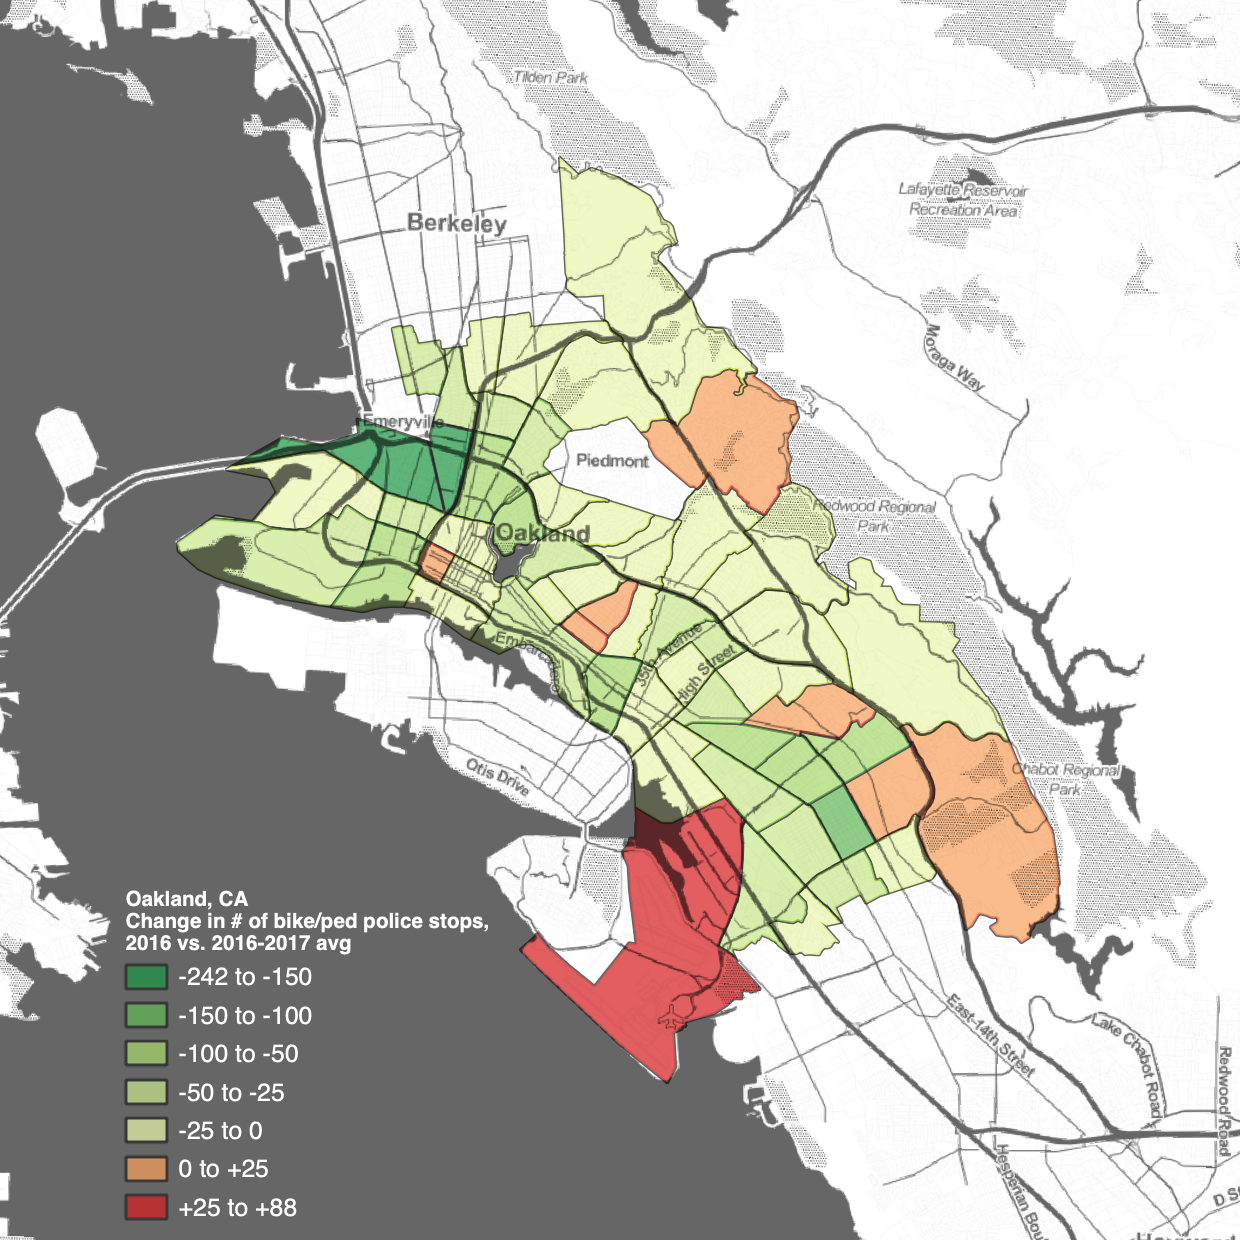
I’d like to believe that the community process around creating the Scraper Bikeway (led by Brytanee Brown, now of The Thrivance Group) and Let’s Bike Oakland (led in this district by Marquita Price of the East Oakland Collective) allowed residents to voice their concerns about police profiling, and started things moving in the right direction. I’m not sure that’s a robust finding, but it’s a nice story.
Conclusion
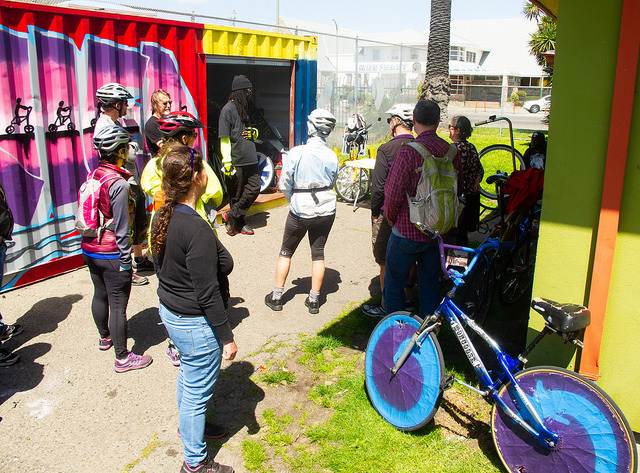
The problem of racial bias in policing is of course not limited to bikes and pedestrians. Part of the premise of The Bike Lab is that the bicycle can be a tool to help understand the social issues of the city. As a white dude, my experience of riding a bike doesn’t include being racially profiled by police, but the shared experience of the bike can help me personalize the injustice experienced by Black kids in East Oakland.
The open questions about addressing racial bias in policing include: Is there anything we can do about it? What actually works? And so far, there are few satisfying answers. Doing less policing may reduce the harm, but not the bias. Maybe bottom-up community engagement can contribute to the solution.