We had been asking people in OakDOT and OPD for the 2018 police stop data for several months, when Robert Prinz (Bike East Bay) found it buried on the City of Oakland open data portal. Apparently it’s been there since April.
Me being me, once I got the data I started grinding away at it, and while I was working on that, Rachel Swan (SF Chronicle) published a story where she interviewed Jennifer Eberhardt, who led the SPARQ study on police bias in Oakland. Swan’s article and Eberhardt’s analysis are congruent with mine; overall, OPD stopped a lot fewer people in 2018, but even after accounting for that, the number of Blacks stopped dropped more than other groups.
Eberhardt suggests that the reduction in stops represents a move towards “intelligence-led” policing. She says, “Officers changed their standard and started using evidence of wrongdoing instead of intuition.” I don’t see how the data supports her assertion. In 2018, 31% of all the stops are listed as “IntelligenceLed”, while in 2016-2017 that number was 29%; a small change, certainly not enough to account for a 30%+ drop in the total number of stops. Looking at only bike and pedestrian stops, the difference is more substantial; 63% of bike and ped stops are listed as IntelligenceLed, compared with 40% in the 2016-2017 data. So bike and ped stops were previously more likely to be based on intelligence, and in 2018 the difference was quite dramatic.
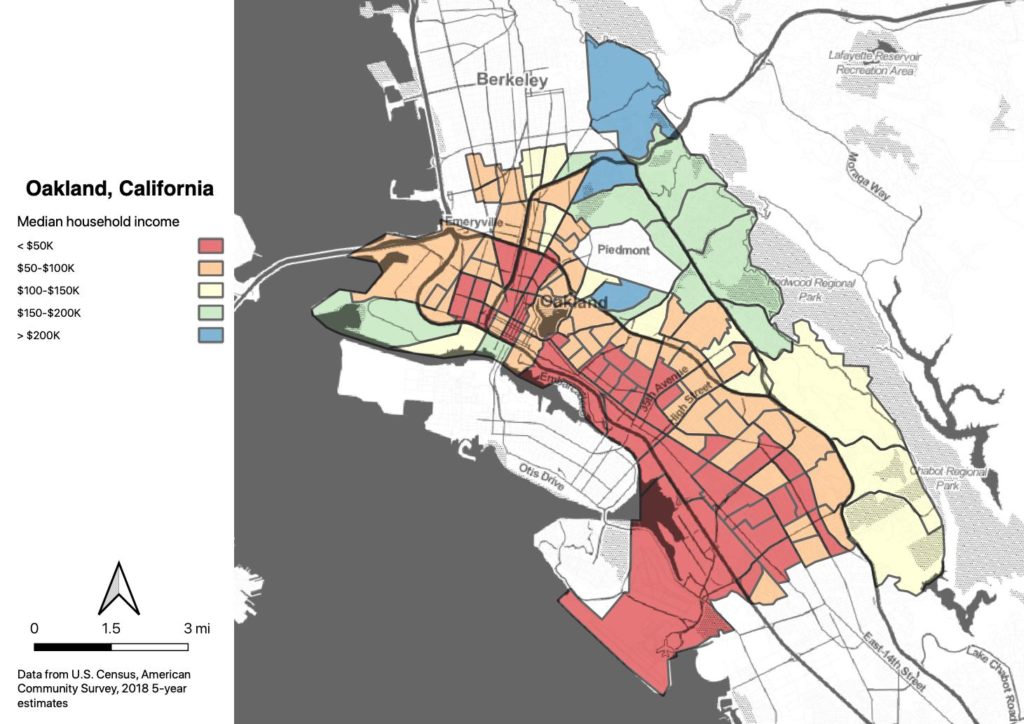
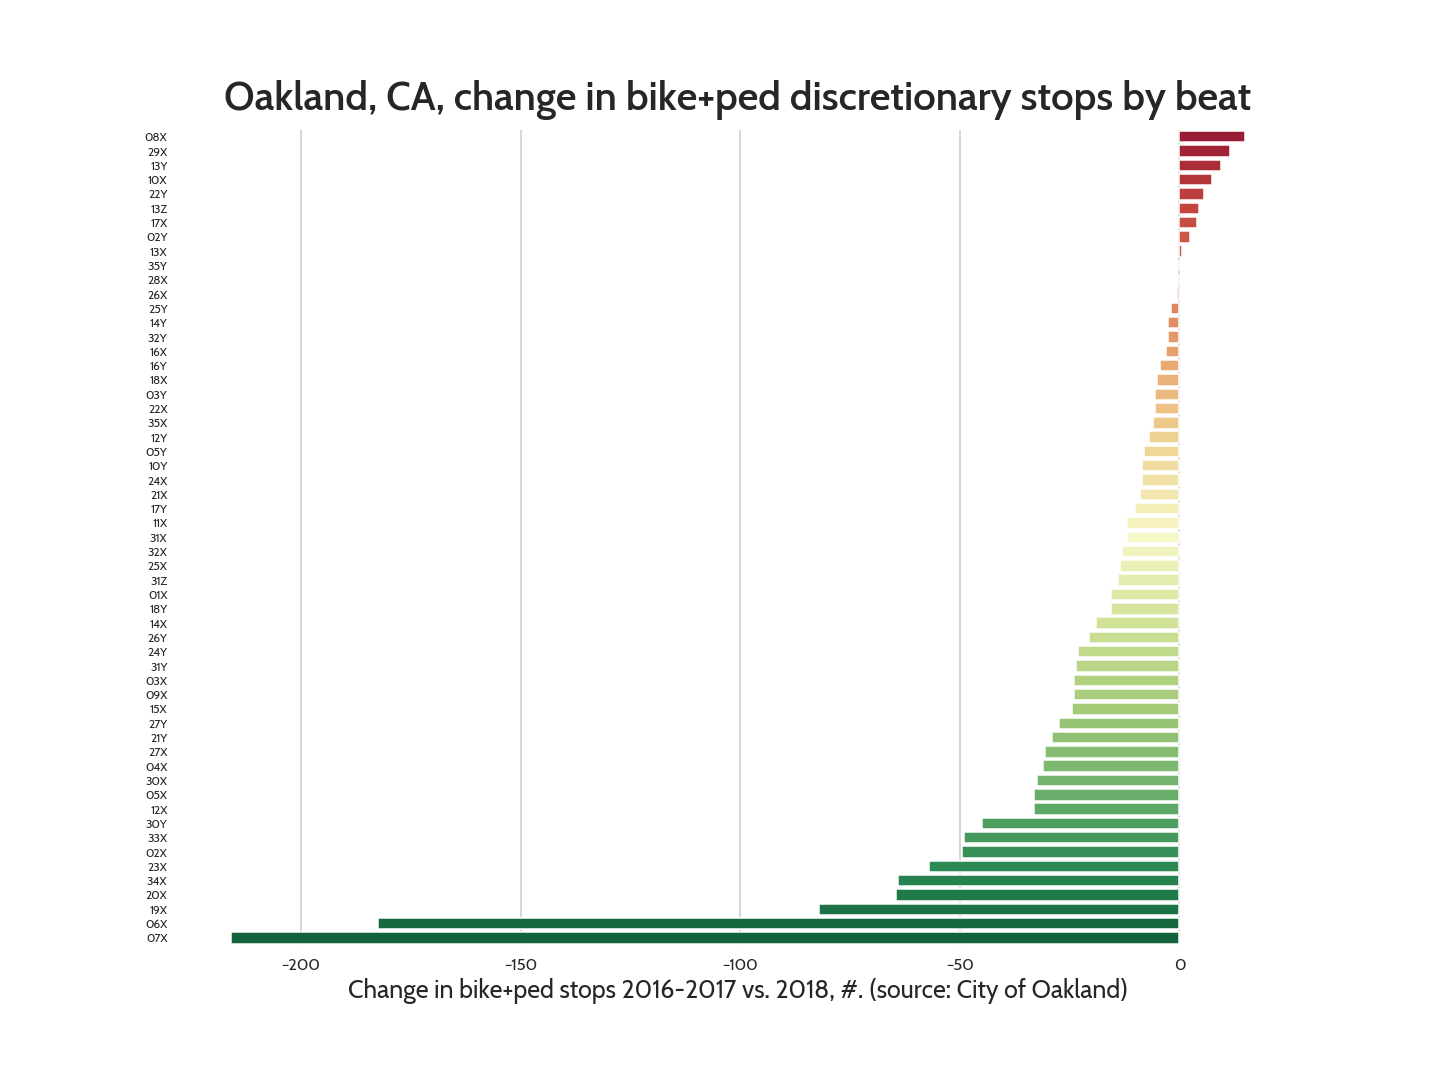
Looked at on a beat-by-beat basis, you can see that the reduction in stops was broad across the city, but the biggest drops came from West and Deep East Oakland. One caveat: The data set ends on December 19 for some reason, so there should be a couple more weeks of data included here, which would make the drop less substantial. Still, there’s obviously a change going on.
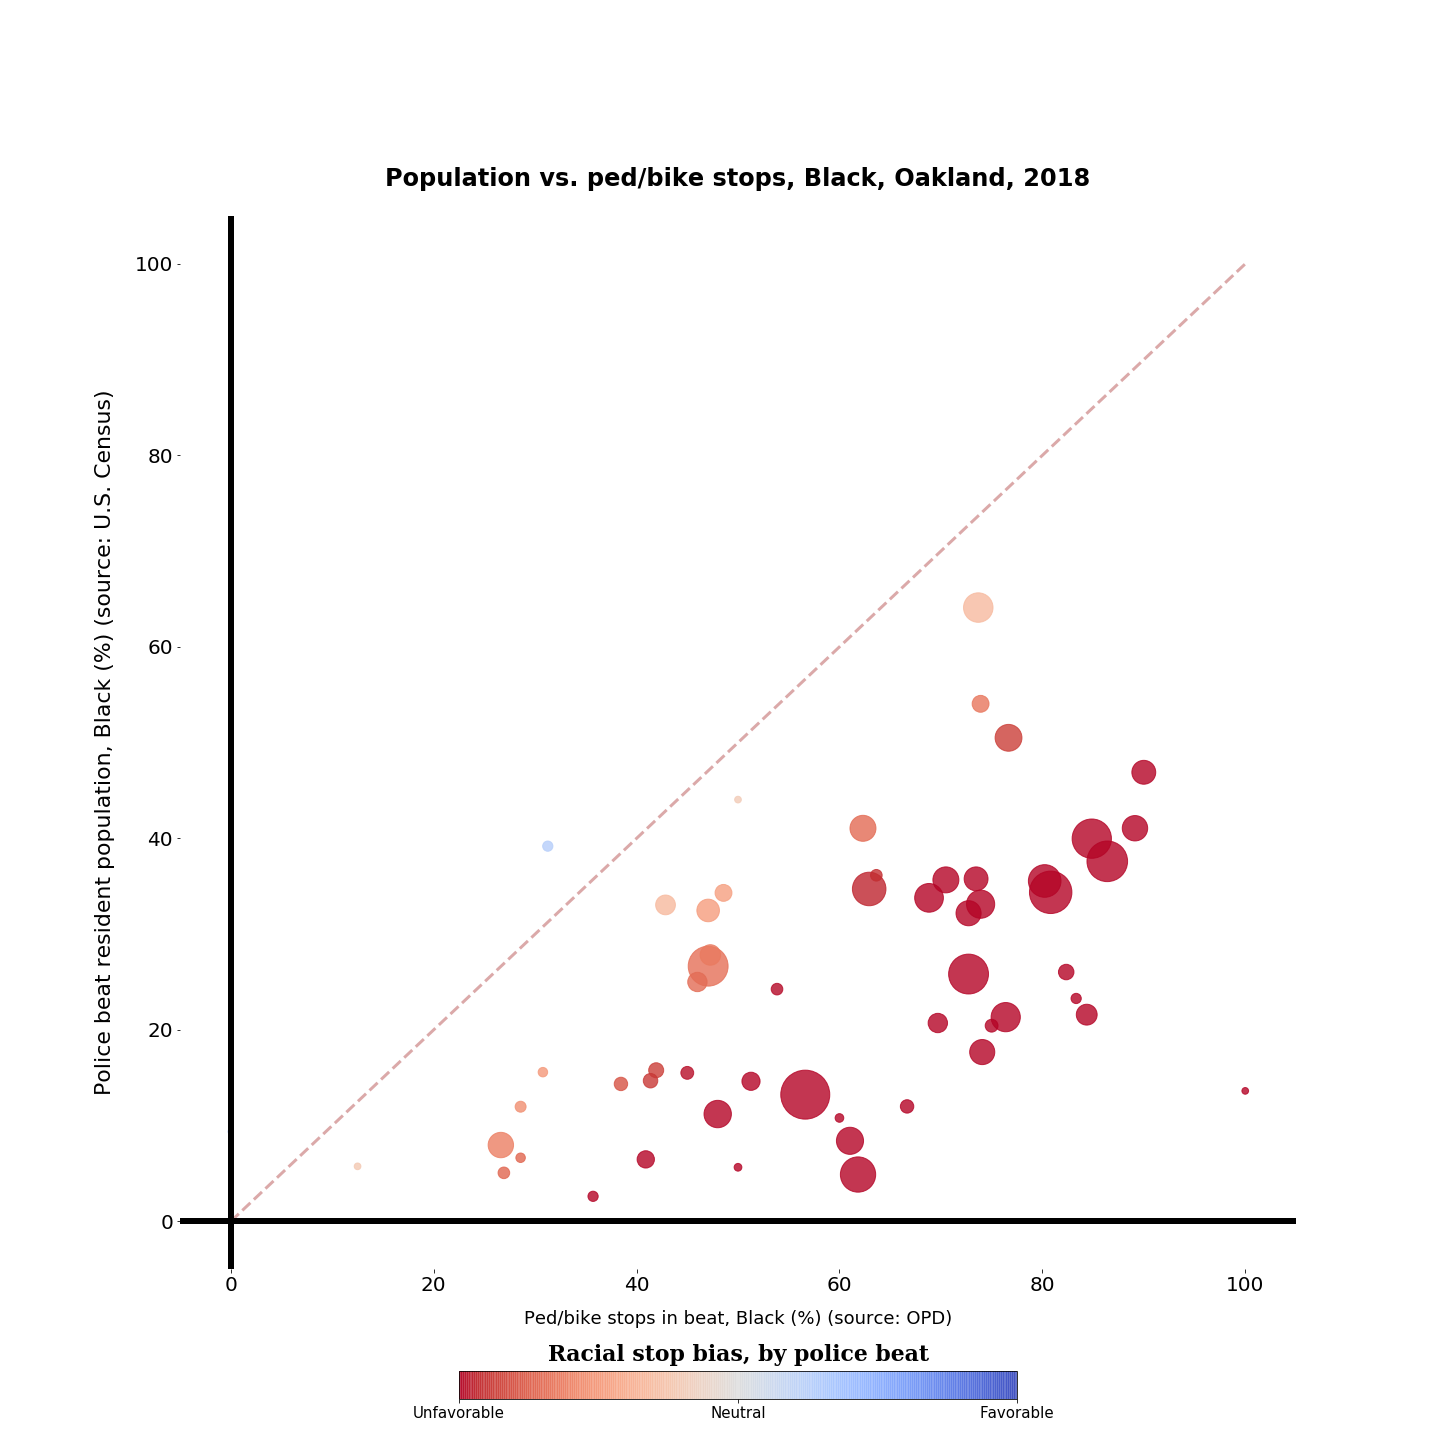
So, there are fewer stops overall, but what about the racial bias? It’s still quite bad. Over 50% of all OPD stops, and over 60% of bike/ped stops were of Blacks. That’s actually an incremental improvement; in 2016-2017 Blacks represented 61% of vehicle stops and 68% of bike and ped stops.
When you compare the beat map with my previous analysis, you can see the decline in the number of stops in West and Deep East Oakland. Interestingly, stops in Fruitvale and Eastlake remained high. The biggest drops by far came in beats 6X and 7X, the north side of West Oakland, which accounted for about one-third of the total reduction in stops.
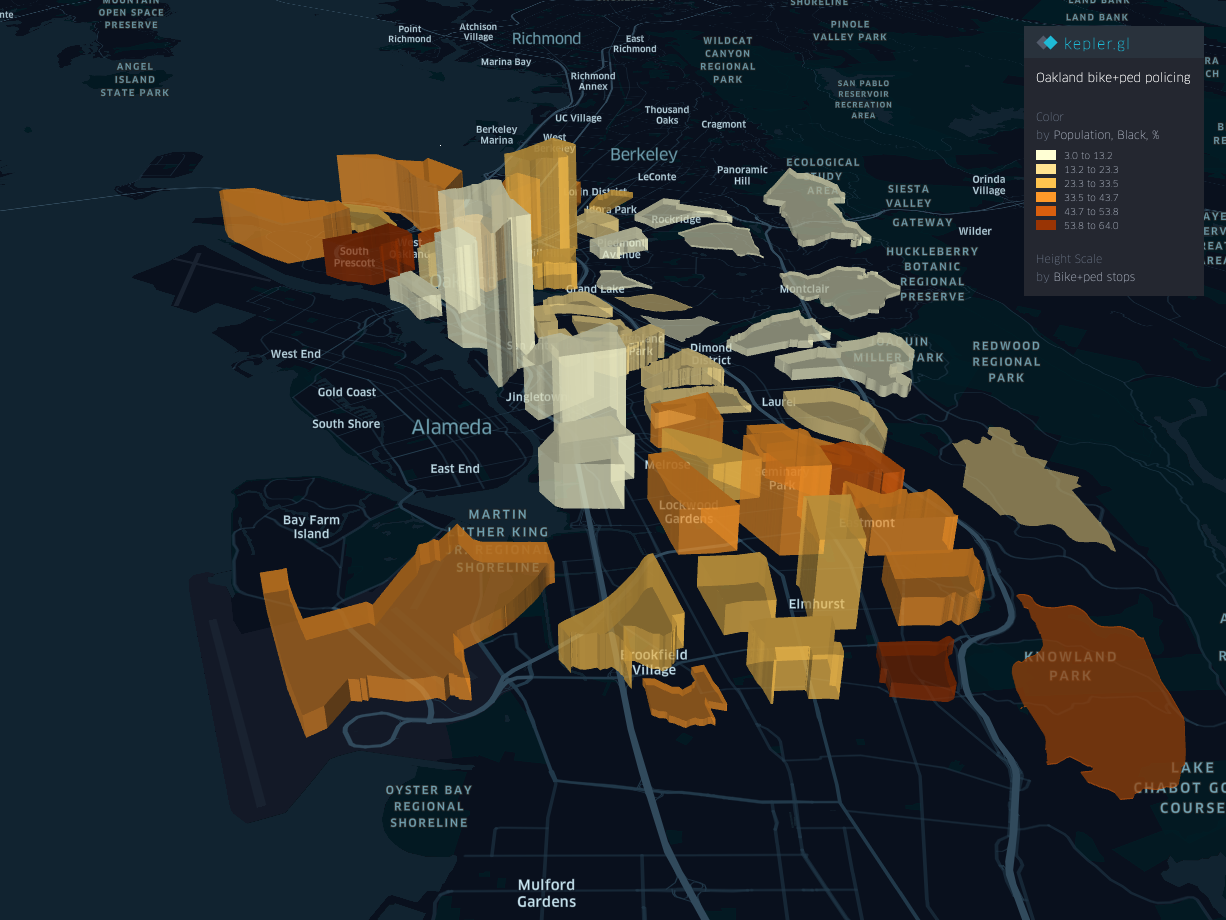
Another caveat: For the demographic numbers, I’m using the 2017 5-year ACS data because the 2018 5-year results haven’t been published yet. So one possible explanation for the drop in stops of Blacks is that there are simply fewer Blacks in Oakland now. The neighborhoods in beats 6X and 7X (Golden Gate, Longfellow, and McClymonds) are among the most rapidly gentrifying in Oakland. My guess is that the demographic shift will not entirely explain the change, but I’ll re-run the numbers next month when we have better population data.
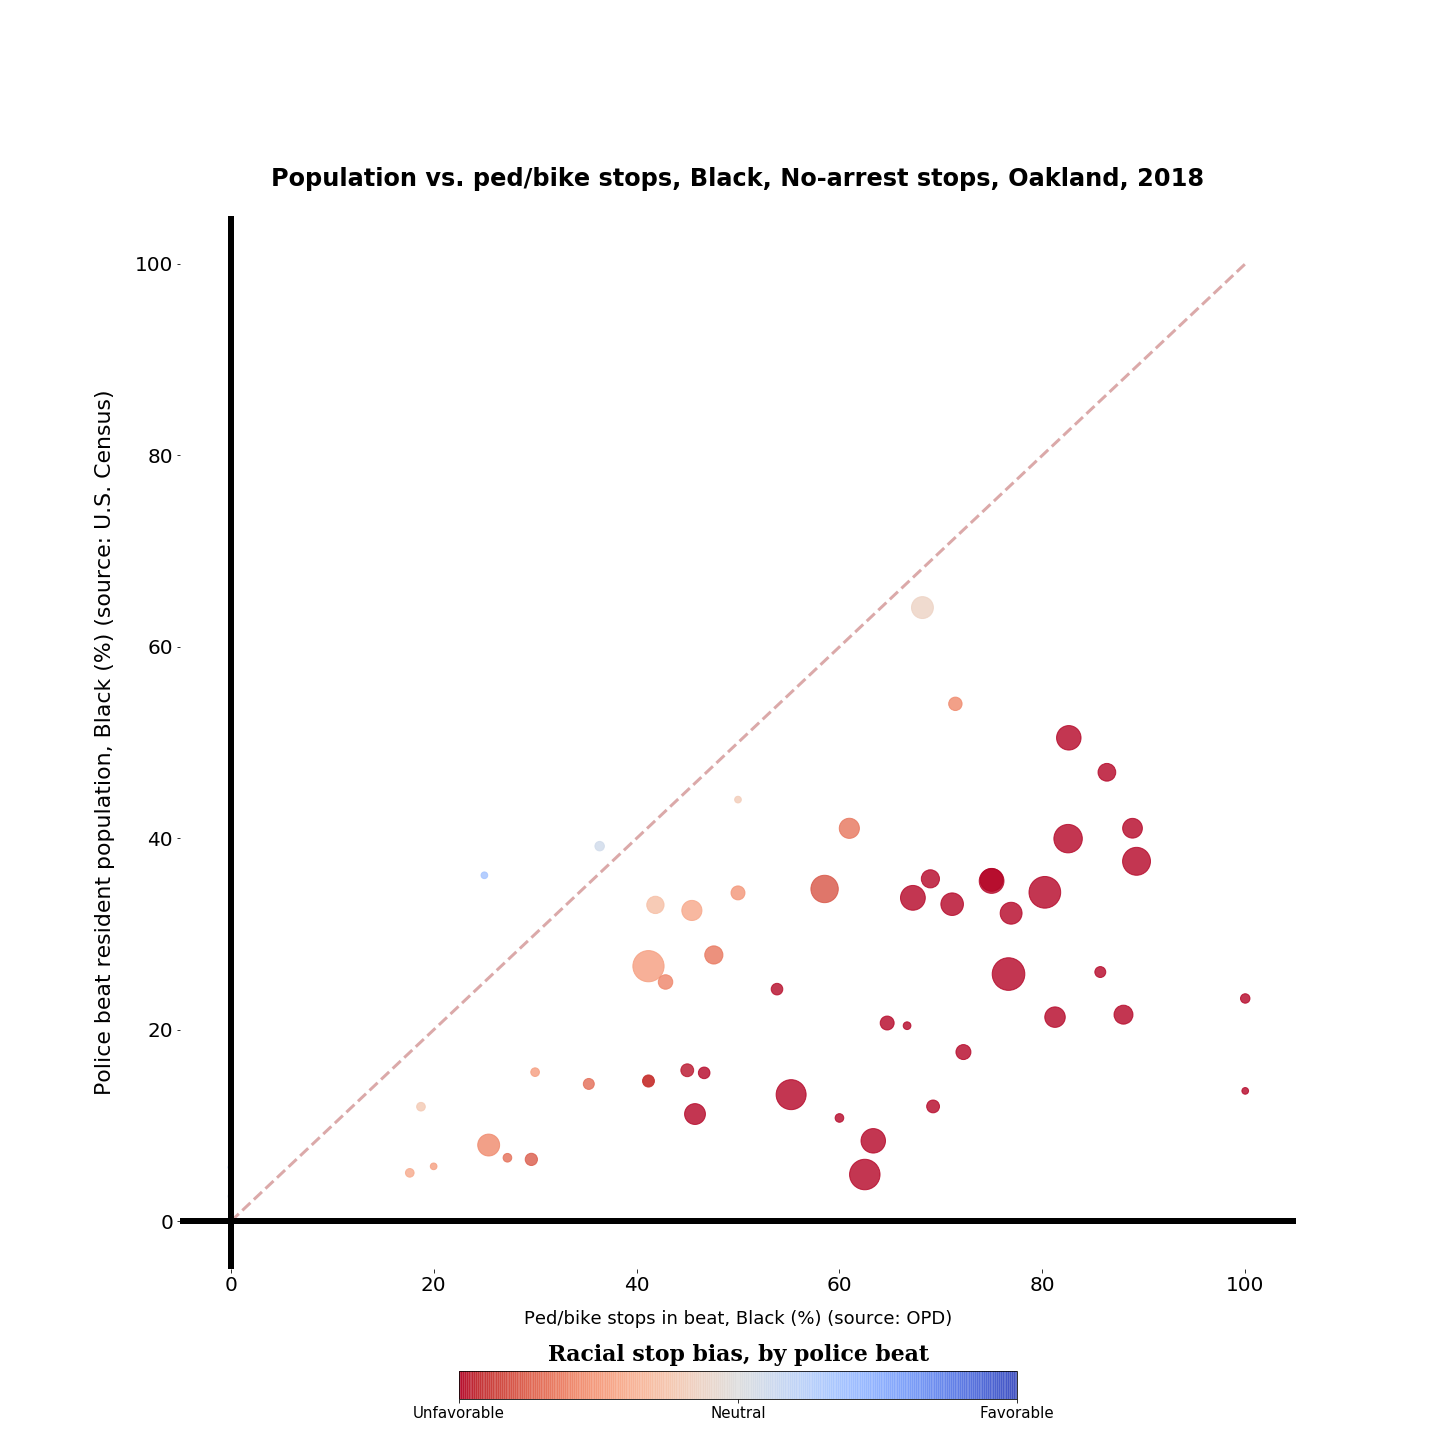
I re-ran the by-beat analysis of bias. City-wide, the percentage of bike and pedestrian stops which were of Blacks dropped to 61.7% from 68.0% in 2016-2017, and that marginal drop is somewhat visible in the data. And unlike last time, there’s actually one police beat where the Black bias shows up on the positive side of the line! That blue point is beat 28X, up by Mills College, and it had just 16 stops in total, but kudos to whoever’s running that beat for not contributing to the problem.
So, there has been an overall reduction in the number of stops, and of the stops which did occur, the proportion which were of Blacks dropped by about six percentage points. Who is being stopped instead? The previous analysis had found a strong bias in favor of Asians, and that bias still exists in the 2018 data, but it is substantially weaker than it was in 2016-2017. And while Whites and Hispanics had been more or less in parity in the 2016-2017 analysis, looking at the 2018 data it appears that bias increased against Hispanics.
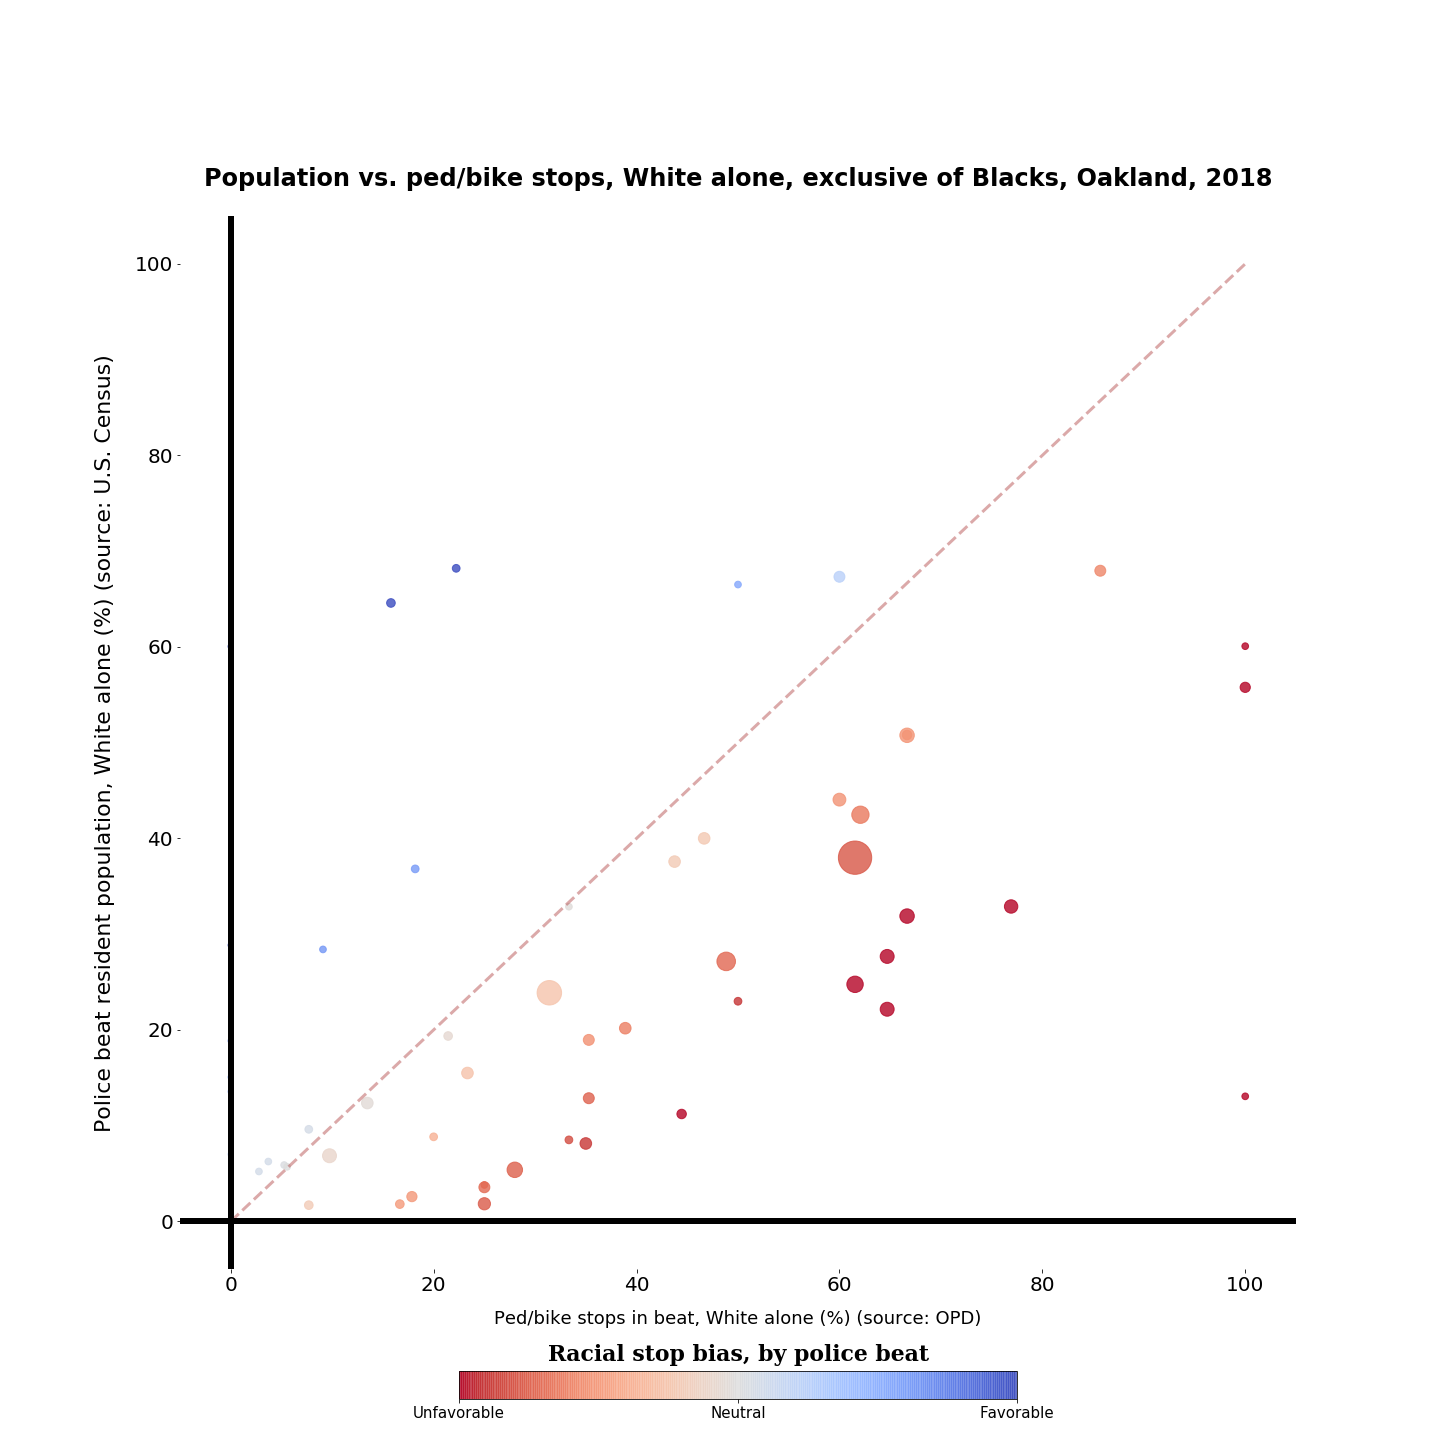
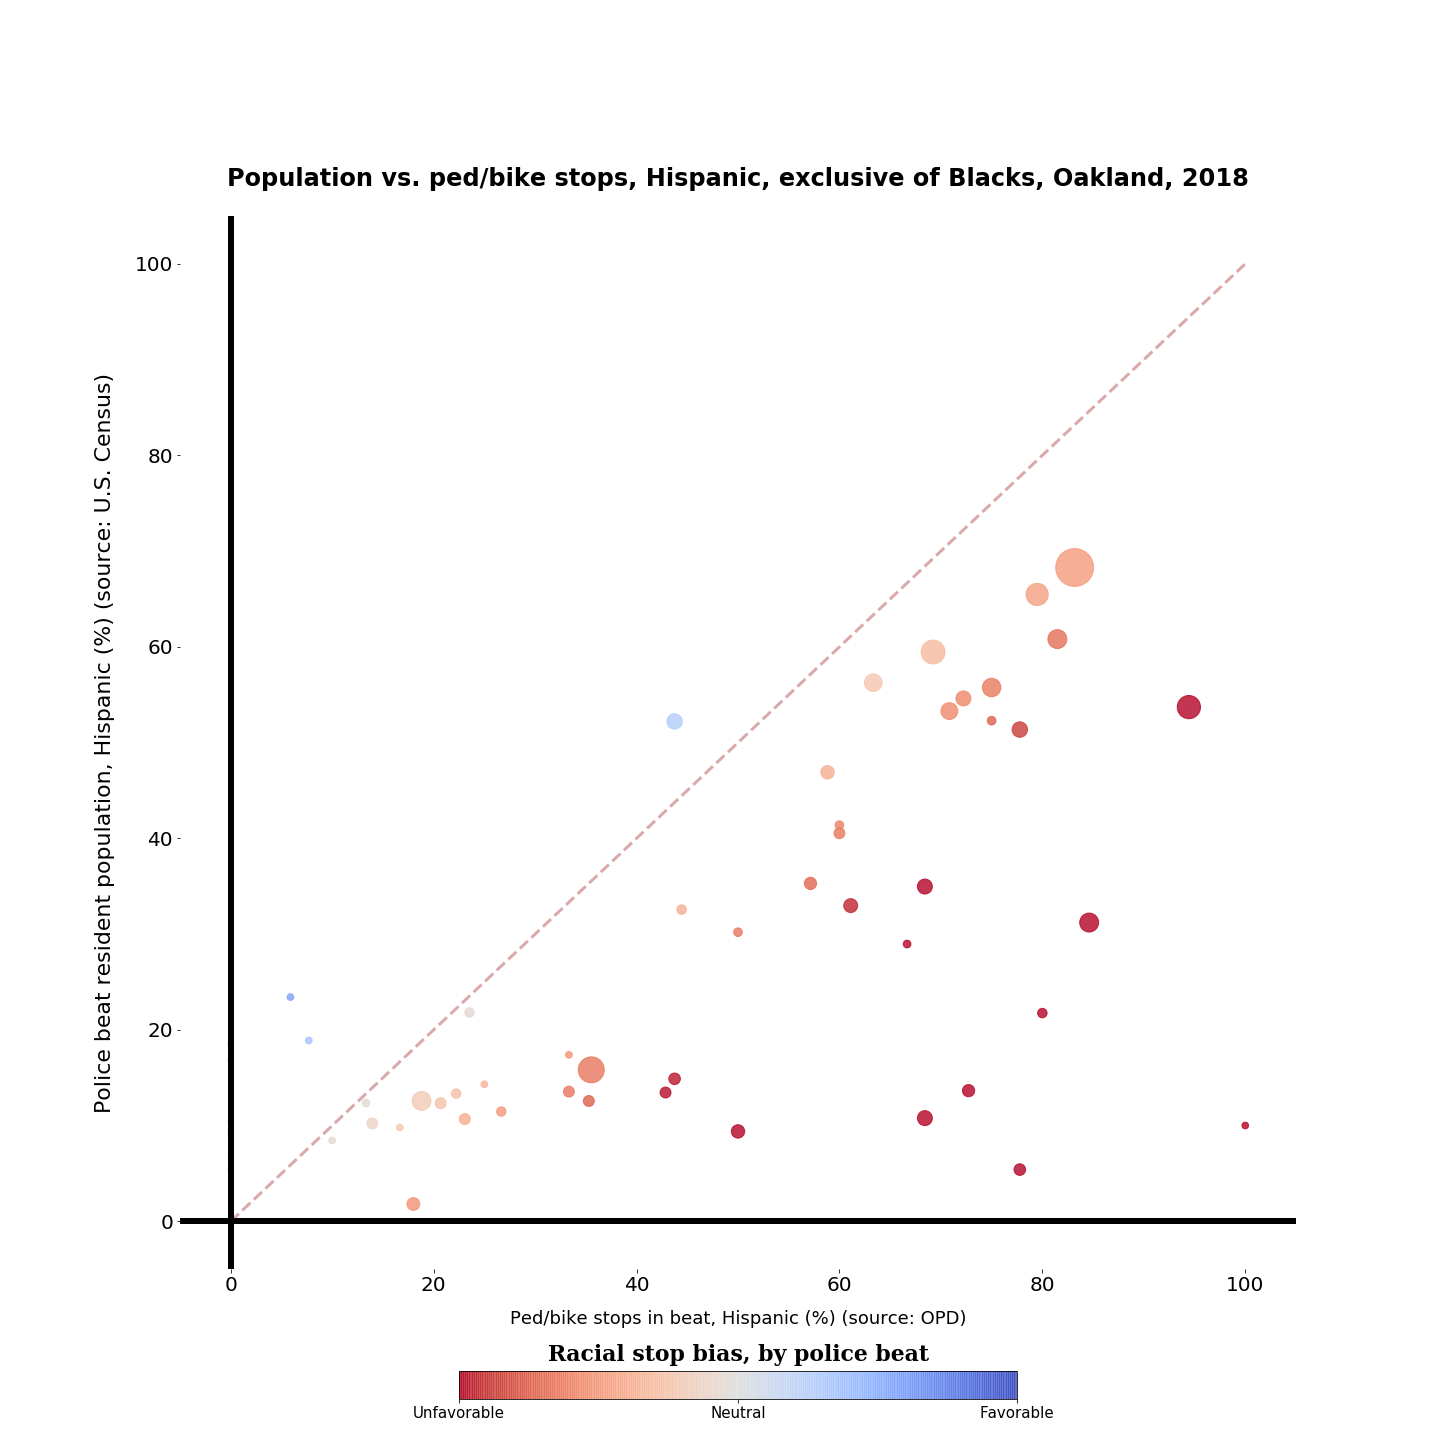
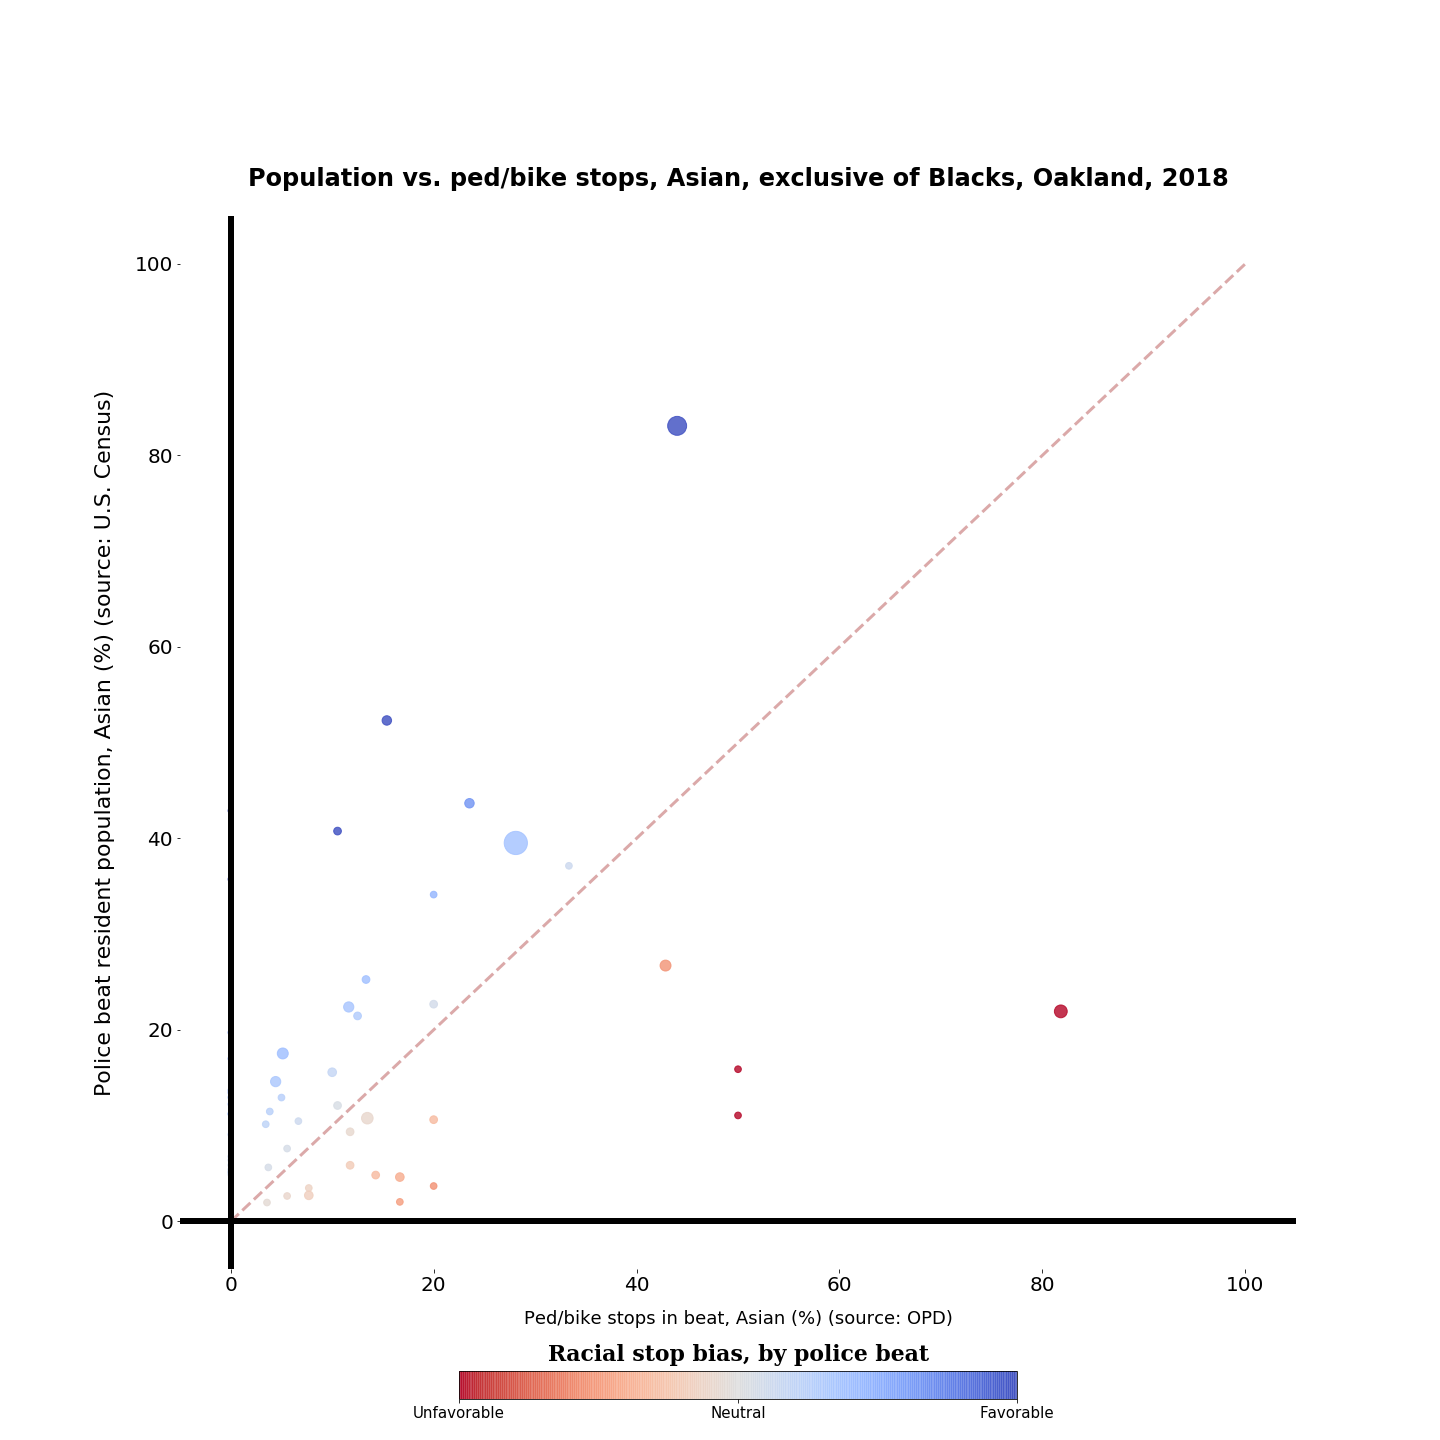
Now, some of that might be explained by demographic changes between 2017 and 2018; we’ll know more in a month when we have the 2018 data. I am pretty sure that Hispanic and Asian populations grew in Oakland during the year, and every police beat where the population grew would move upwards on these graphs. But given the data we have today, it looks like the bias in favor of Asians marginally declined, and the bias against Hispanics marginally increased, which combined to marginally reduce the bias against Blacks.
Looking only at stops which did not result in an arrest, Blacks represent 59% of the population, slightly below their representation in all stops (61.7%). Conversely, 66% of stops of Blacks resulted in arrests, so Blacks were slightly more likely to be arrested when stopped.
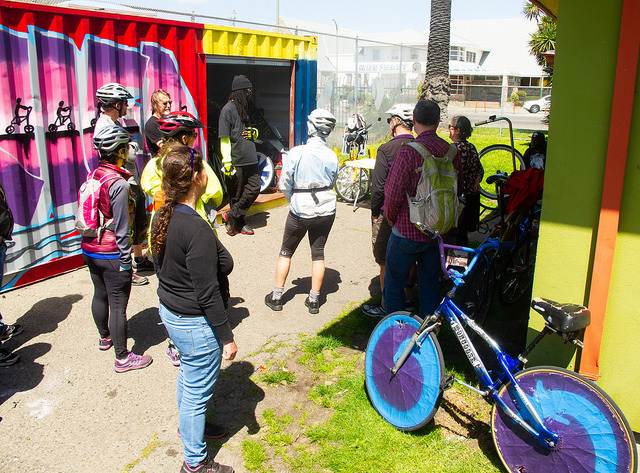
One possible, and incorrect, way to look at this data would be to conclude that OPD is justified in stopping more Blacks, because Blacks are more likely to be “arrestable,” presumably because they’re doing something wrong. The reason why that conclusion is incorrect is related to the incident which got me into this work in the first place; Naj K. Smith’s arrest for having a bike with a sound system. Here’s Naj’s record in the data set:
| ContactDate | 8/3/18 |
|---|---|
| Beat | 04X |
| Race | Afr American |
| Gender | Male |
| EncounterType | Bicycle |
| ReasonForEncounter | Traffic Violation |
| Search | TRUE |
| TypeOfSearch | Incident to Arrest |
| ResultOfSearch | None |
| ResultOfEncounter | Misdemeanor Arrest |
| IntelligenceLedFactor | No |
Najari shows up here as an African American who was stopped for a traffic violation, searched, and arrested. But there was no reason to stop him, no reason to search him, and no reason to arrest him. This is a record of an injustice. How many other records in the data set are similar? We have no way of knowing. But I’m willing to bet that there are many more, and that they’re biased against Blacks. So the raw data OPD reports is only telling part of the story.
Worse, part of the reason OPD is under federal oversight is because of falsified police records, yet a 2018 audit found that use-of-force data is still being under-reported, and that Blacks are disproportionately affected by that under-reporting. Blacks were the targets of 89% of the unreported drawn firearms, and 80% of the unreported “weaponless defense technique” incidents—control holds, hair grabs, kicks, leg sweeps, etc. So even the bias that’s visible in the data set is probably only a portion of the overall problem.
De-emphasizing discretionary stops is a start; combined with a marginal decrease in bias against Blacks, it resulted in about one-third fewer reported stops of Black bicyclists and pedestrians in 2018. But the number of stops of Blacks is still huge relative to their numbers in Oakland. In absolute numbers, there were almost 2,000 stops of Black bikes and pedestrians, and only 387 stops of whites. We know that’s not only unequal but also inequitable. And there has to be a limit to how far you can move towards equity simply by reducing discretionary stops.
I’m open to ideas. Got any?