There are two reasons I’m visiting cities to ride the infrastructure. One is that I want to get a better sense of the subjective experience of the place; I feel like I can’t really understand a city unless I’ve ridden through it. The other is that I want to identify specific issues with the infrastructure. Bikeway mileage is a poor measure for a number of reasons, and one of those is that poor bikeway design can create more problems than it solves. Some paths and lanes provide a great user experience and improve safety, some are more or less neutral, and others are actively dangerous. But no matter how good or bad the facility is, it’s counted in the bikeway mileage. I’d like to get to a measure like “value over replacement facility” which counts mileage only for clearly bike-oriented improvements, and discounts those facilities which include hazardous conditions.
So, I’m riding the bikeways with a GPS tracker (phone-based, PixTrack) and a GoPro shooting time-lapse photos. Here’s the routes I rode in Charlotte, with a few segments missing due to glitches of one sort or another. It came out to just under 100km:
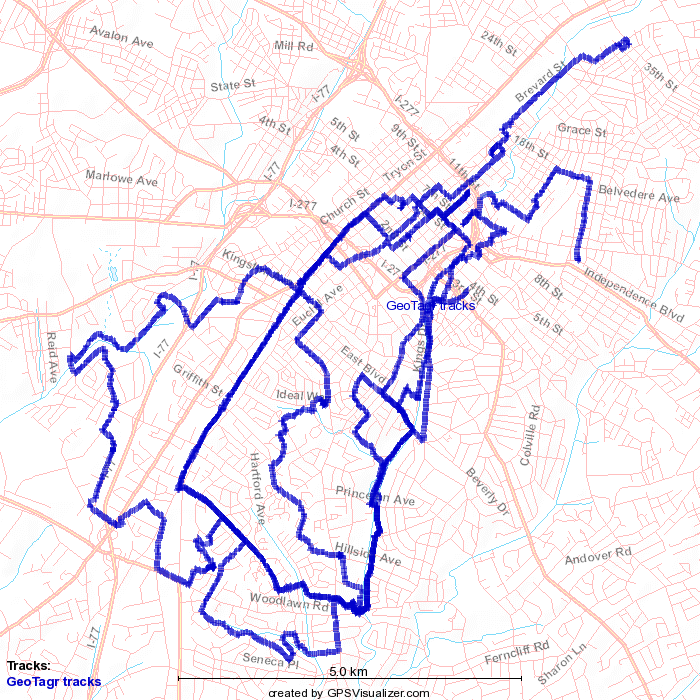
I use those tracks to geo-tag the time lapse photos, add date, filename, and geotag labels to them, and turn them into a time-lapse video. I wound up with almost 30,000 images from this trip, which at one per second is about 500 minutes of riding, just over 8 hours. That’s a lot of images, and the GUI tools were having some difficulty digesting that fat wad of data, so I dug into my bag of Unix command-line tricks and wrote a hacky Perl script using exiftool and ImageMagick to do the tagging and labeling.
The idea is to be able to use the video to go back and look through the videos to identify problematic areas; pinch points, poor intersections, discontinuous facilities. This will at some point get pulled into GIS, with the facility map overlain with identified problems. That will be connected with some sort of measure of neighborhood change, probably a combination of median income, land value, ethnic makeup, and educational attainment.
The issue is that lots of cities have lots of bikeway mileage that doesn’t provide value. (I’d say that includes most bikeway mileage in most U.S. cities). When trying to dig into causal relationships between bikeways and neighborhood change, it would be useful to be able to identify the areas where value-added facilities exist, and discount the places where there’s just a white stripe in the gutter of a busy arterial.
Here’s the video from Charlotte. It’s not really designed for human consumption but you can see where I’m going with this.