A number of people had mentioned that I should meet with Laura Dierenfield, the City of Austin’s manager of “Active Transportation.” Fortunately I’d already had a meeting set up with her, and she was kind enough to invite a number of her staff members to discuss their projects. One of them, Nathan Wilkes, has a strongly quantitative approach and has done a bunch of analysis of different aspects of active transportation.
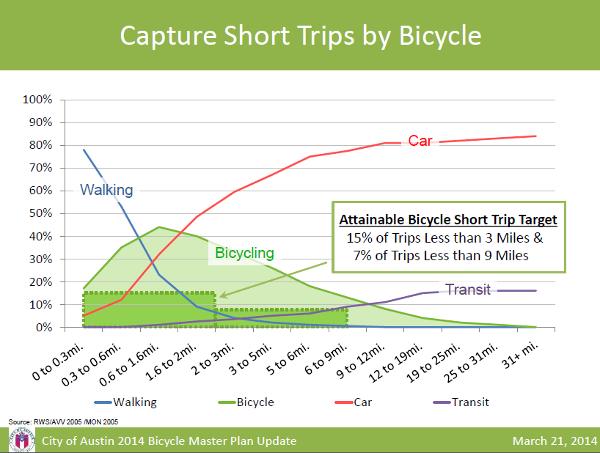
One of the more interesting points Nathan raises is the concept of “attainable mode share.” Based on data from Amsterdam, he looked at the percentage of trips of different lengths which can be captured by different modes. For extremely short trips, walking will be the preferred mode. For extremely long trips, car or train will be preferred. But for intermediate trips of 1-2 miles, it may be possible to capture a large percentage of the trips on bike. And because those trips are more common than extremely long trips, you can make real progress on auto trip reduction goals if you can increase the amount you capture those intermediate trips.
Another point he raised is that the city limits of Austin have expanded over time. If look at the mode share data from ACS on a census tract basis, and take an area of central Austin comparable to the area of San Francisco (~49 sq. mi.), the cycling mode share is close to San Francisco’s. But in the past 20 years Austin has annexed a lot of low-density outlying areas where cycling is uncommon. His assertion (which seems plausible) is that the real cycling mode share in Austin has been going up faster than the ACS data would indicate. I’ll have to think about that in the context of Minneapolis/St. Paul; Minneapolis’s mode share is at least double St. Paul’s, and they really could be considered a single city. What if Austin were two cities divided by the river? North Austin would have a lot more cycling than South Austin.
Anyway, the folks were all really helpful and engaged, and one of the staffers (Lizzie) followed up with GIS data indicating all of the bike projects they’ve built, tagged with location and date. That’ll be super-helpful as I try to relate it to areas where neighborhoods have changed over time.