During the fall semester I took two relevant classes, one an introduction to GIS, and one on Active Transportation (with Professor Daniel Rodríguez, formerly of UNC-Chapel Hill, who will act as my thesis advisor). For my final project in the Active Transportation class, I used GIS tools to analyze bike mode share, bikeway mileage, and crash data for the four cities.
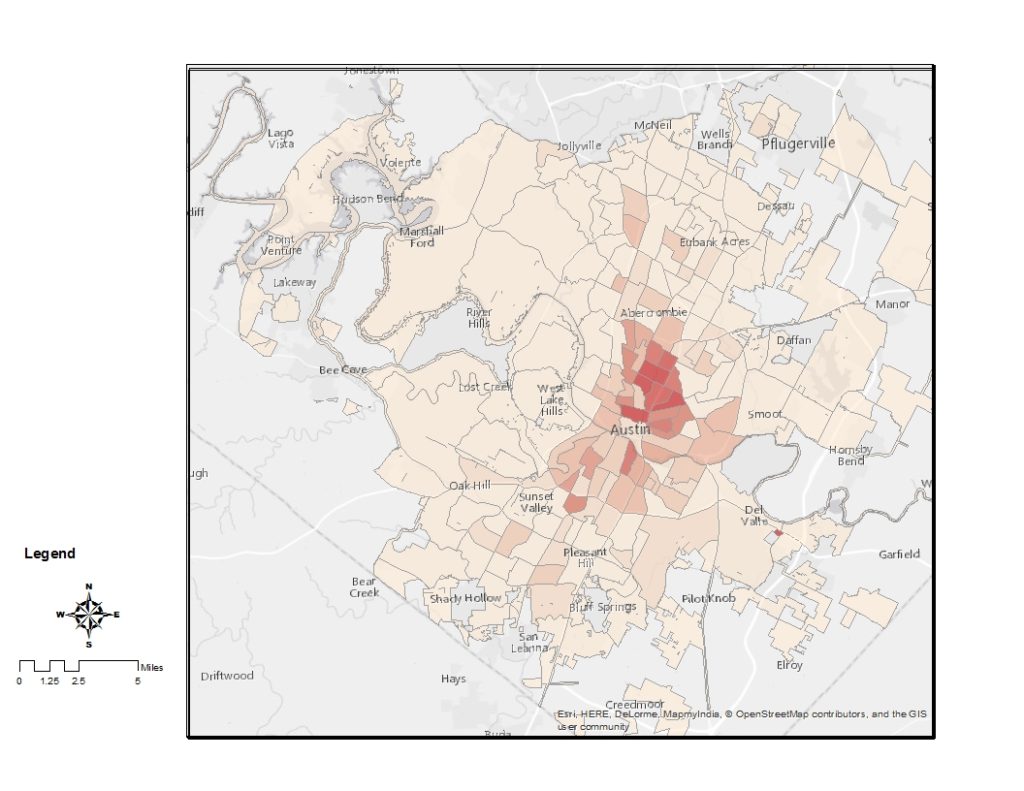
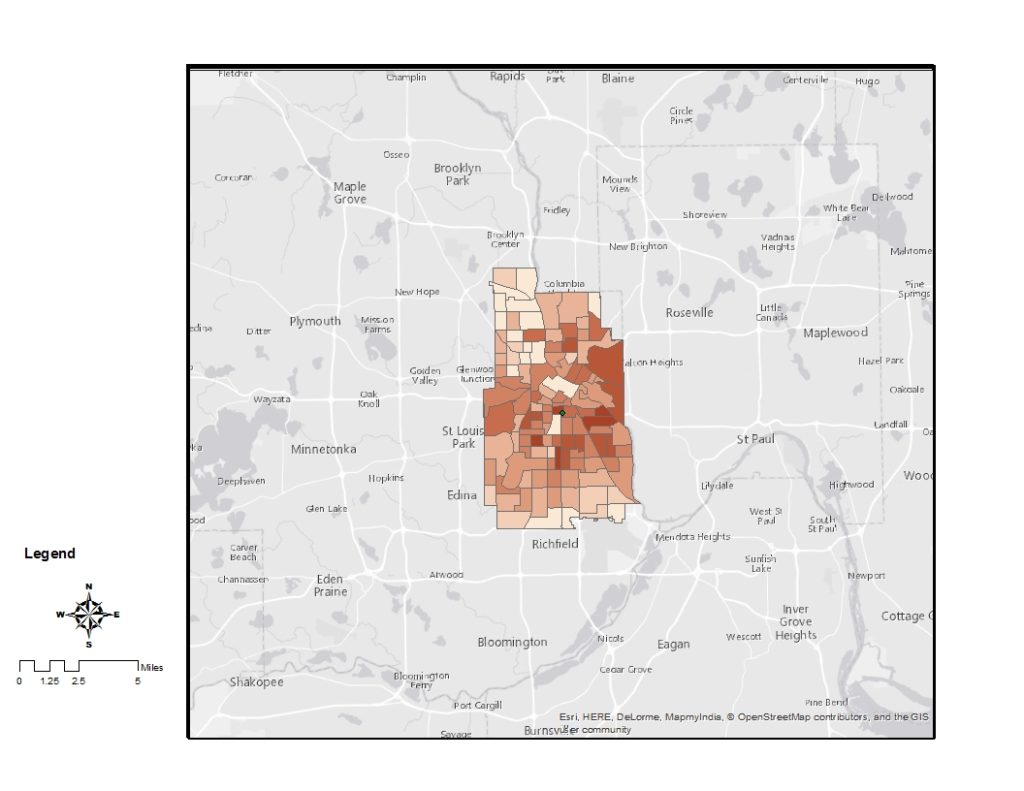
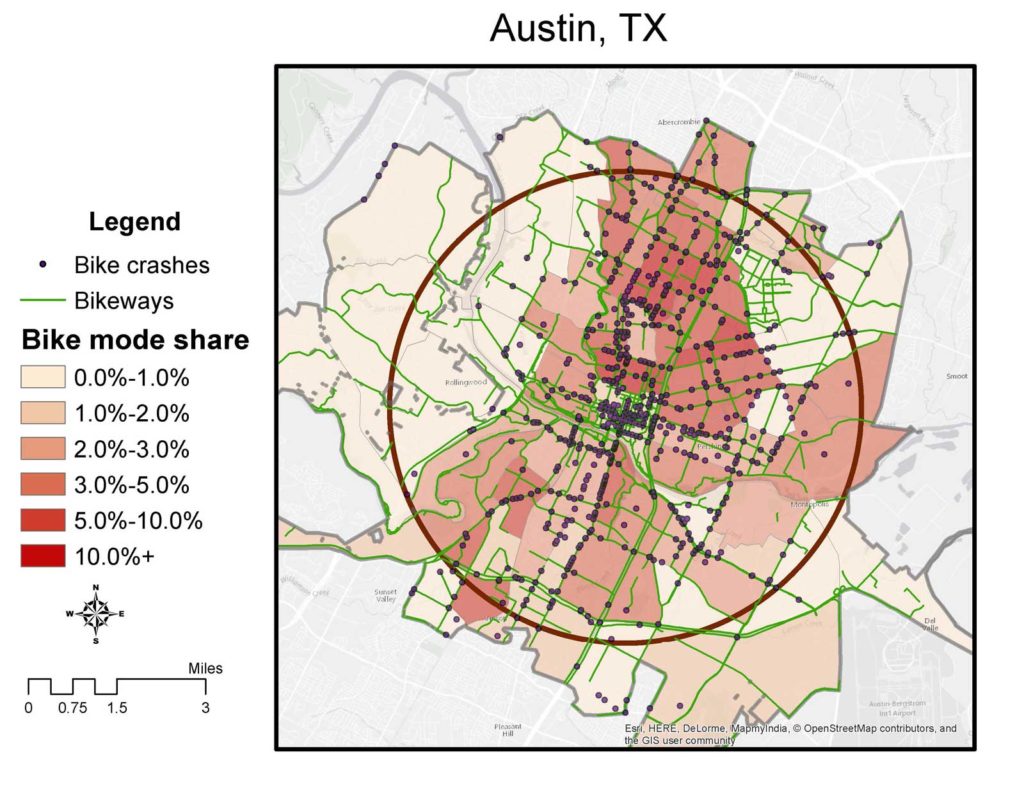
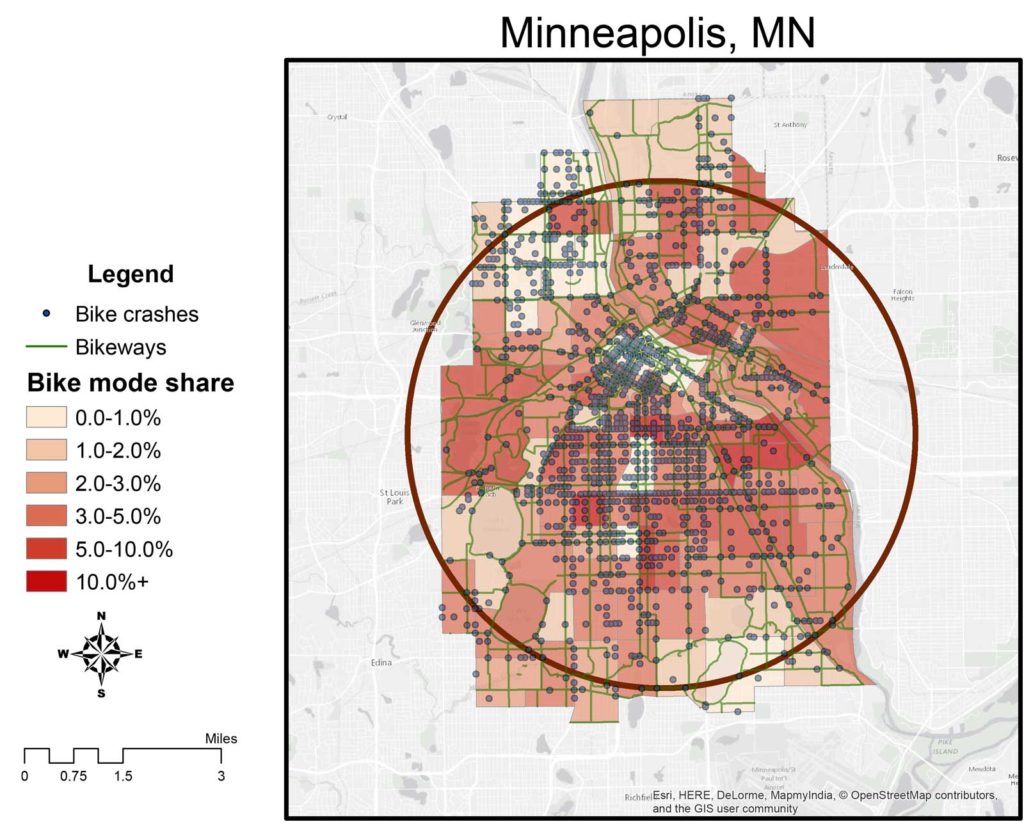
One problem I noticed while doing field research is that the city extents vary greatly; Austin, for example, has over six times Minneapolis’ land area, which means that Austin includes some sprawling, low-density areas with low cycling rates that are excluded from Minneapolis’ mode share numbers. Nathan Wilkes (from Austin’s Active Transportation Department) had done some work comparing mode share in the downtown area of Austin to San Francisco, to point out that the city has actually made more progress than would be evident from looking at the city-wide data.
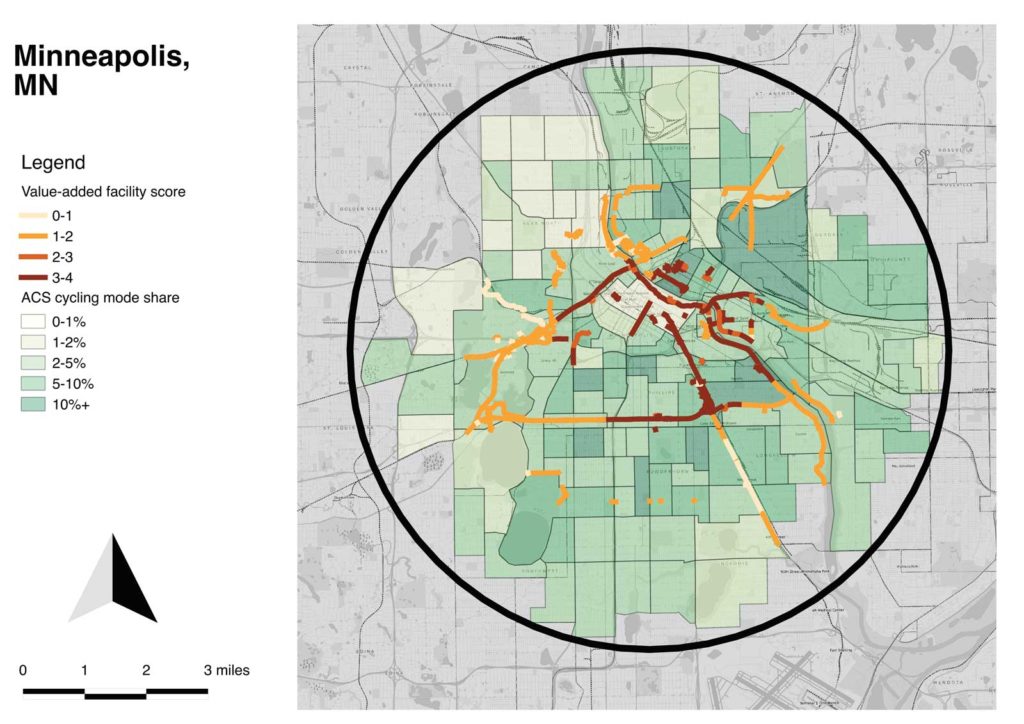
I looked at creating a 4-mile radius circle to encompass the highest-cycling area of each city (by ACS mode share data), to be able to develop more comparable metrics from city to city. I think the method will prove very useful in the data analysis portion of the work, though I’ll make some tweaks to it in the final version. For this work I selected all census tracts which intersected the circle, but the resulting extents are still quite different in land area (by almost a factor of two). For the paper I’ll probably use a 5-mile radius and select only the census tracts which are completely included in the circle. I’ll also include census tracts outside of the central city if the circle includes them (which might affect Minneapolis, but not any of the other cities).
There are still a lot of issues with the data, but at least I’ll be comparing rotten apples to rotten apples.
Here’s the full paper if you’re interested.