The 2017 National Household Travel Survey (NHTS) data was released a while back, and I finally got a chance to dig into it. NHTS’s sample sizes are too small to be used to compare cities, but the trip data it captures is much more robust than the American Community Survey, which only asks about your most common journey to work. NHTS uses actual travel logs, so it captures all trips, including multi-modal trips.
NTHS is also done only periodically, with the last survey being in 2009. My thesis used data from that survey (and others) to show that low-income Hispanics are substantially more likely to use bikes than other demographic groups, and that we don’t spend enough time thinking about them and their relationship to cycling. (One commission member in Austin, TX, rejected a cycling bond measure because “a lot of Mexicans aren’t going to be riding bikes.”)
In preparation for my talk next week at Luckyduck Bicycle Cafe, I dug into the 2017 data to see if the findings from 2009 hold, and they mostly do. The one thing that’s notably different is that for the lowest-income groups, Asians have slightly higher cycling mode share than Hispanics in the 2017 data (1.1% vs. 0.9%). Hispanics have the highest overall cycling mode share (except for American Indians, which I omit here because of small sample sizes):

When adding in walk trips, the difference gets even more substantial. Almost 15% of trips by low-income Hispanics are by active modes, and almost 10% overall, almost triple the rate of Whites. Asians and Blacks are almost double Whites.
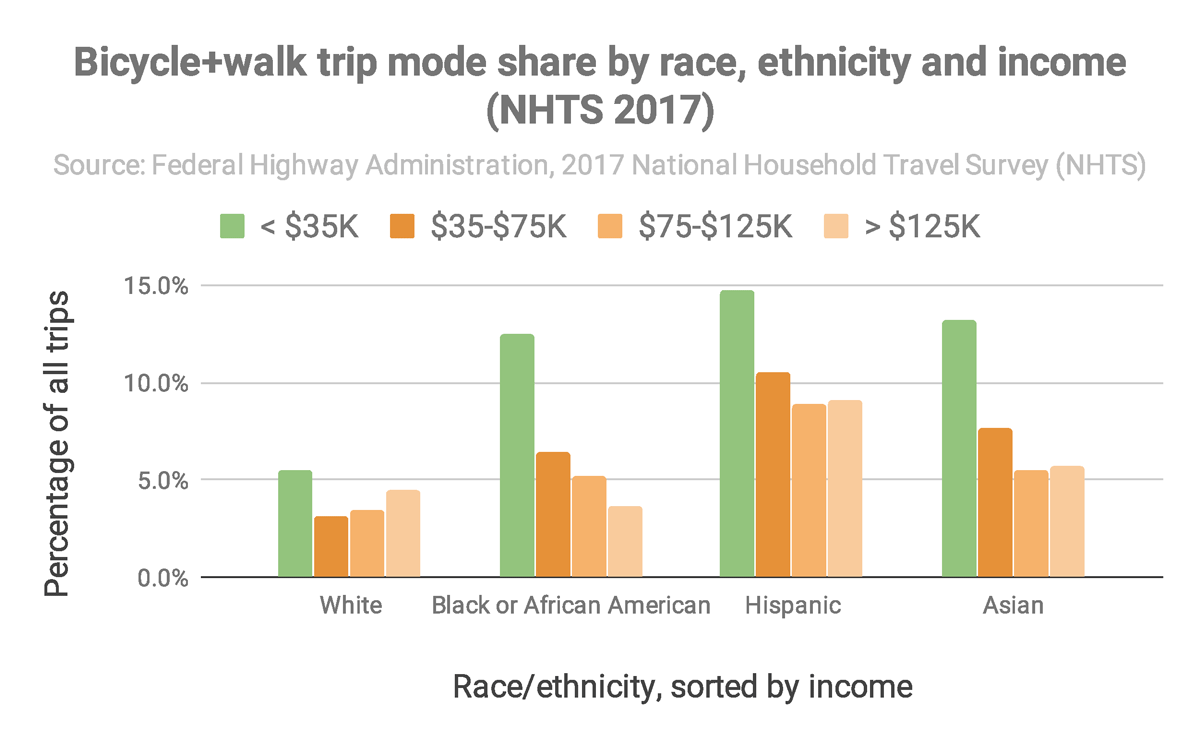
There are some interesting effects with income. The lowest use of active modes (3.2%) is among lower middle-income Whites ($35-$75K), but amongst affluent Whites (> $125K) the rate is almost as high as among the poor (4.4% vs. 5.5%). In all other ethnic groups, the poorest group uses active mode substantially more than those with higher incomes, particularly amongst Blacks, where the poor are four times as likely to walk or bike.
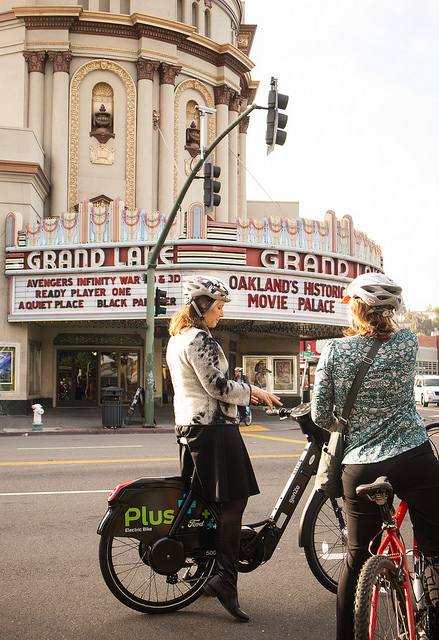
I have two take-aways from this. One is the need to reiterate that the common cyclist is not an affluent white dude. Policy-makers sometimes believe that because Whites often dominate the bike advocacy group and show up at commission and council meetings. (Not so true in Oakland, but still true in most places.) At every income level, Whites are cycling less than other racial and ethic groups.
The other is that the data suggest substantial differences in cultural relationships to active transportation modes. It’s surprising to me (in a good way) that 9.1% of Hispanics with incomes >$125K choose to walk and bike; less surprising that only 3.6% of affluent Blacks do. Affluent Asians are unlikely to ride bikes relative to those with less income. Middle-income Whites are less likely than those with low or high incomes to choose active modes, which may be a factor contributing to the founding question of the Bike Lab: Why has bike infrastructure become associated with gentrification?