Skip to content
Home
About the Bike Lab
Philosophy
Thesis
Field work
Austin, TX
Charlotte, NC
Columbus, OH
Minneapolis, MN
Search for:
Search
Search
Home
About the Bike Lab
Philosophy
Thesis
Field work
Austin, TX
Charlotte, NC
Columbus, OH
Minneapolis, MN
race_black-bikeped-stops-scatter
Leave a Comment
/ By
Tom Holub
/
May 17, 2019
Previous
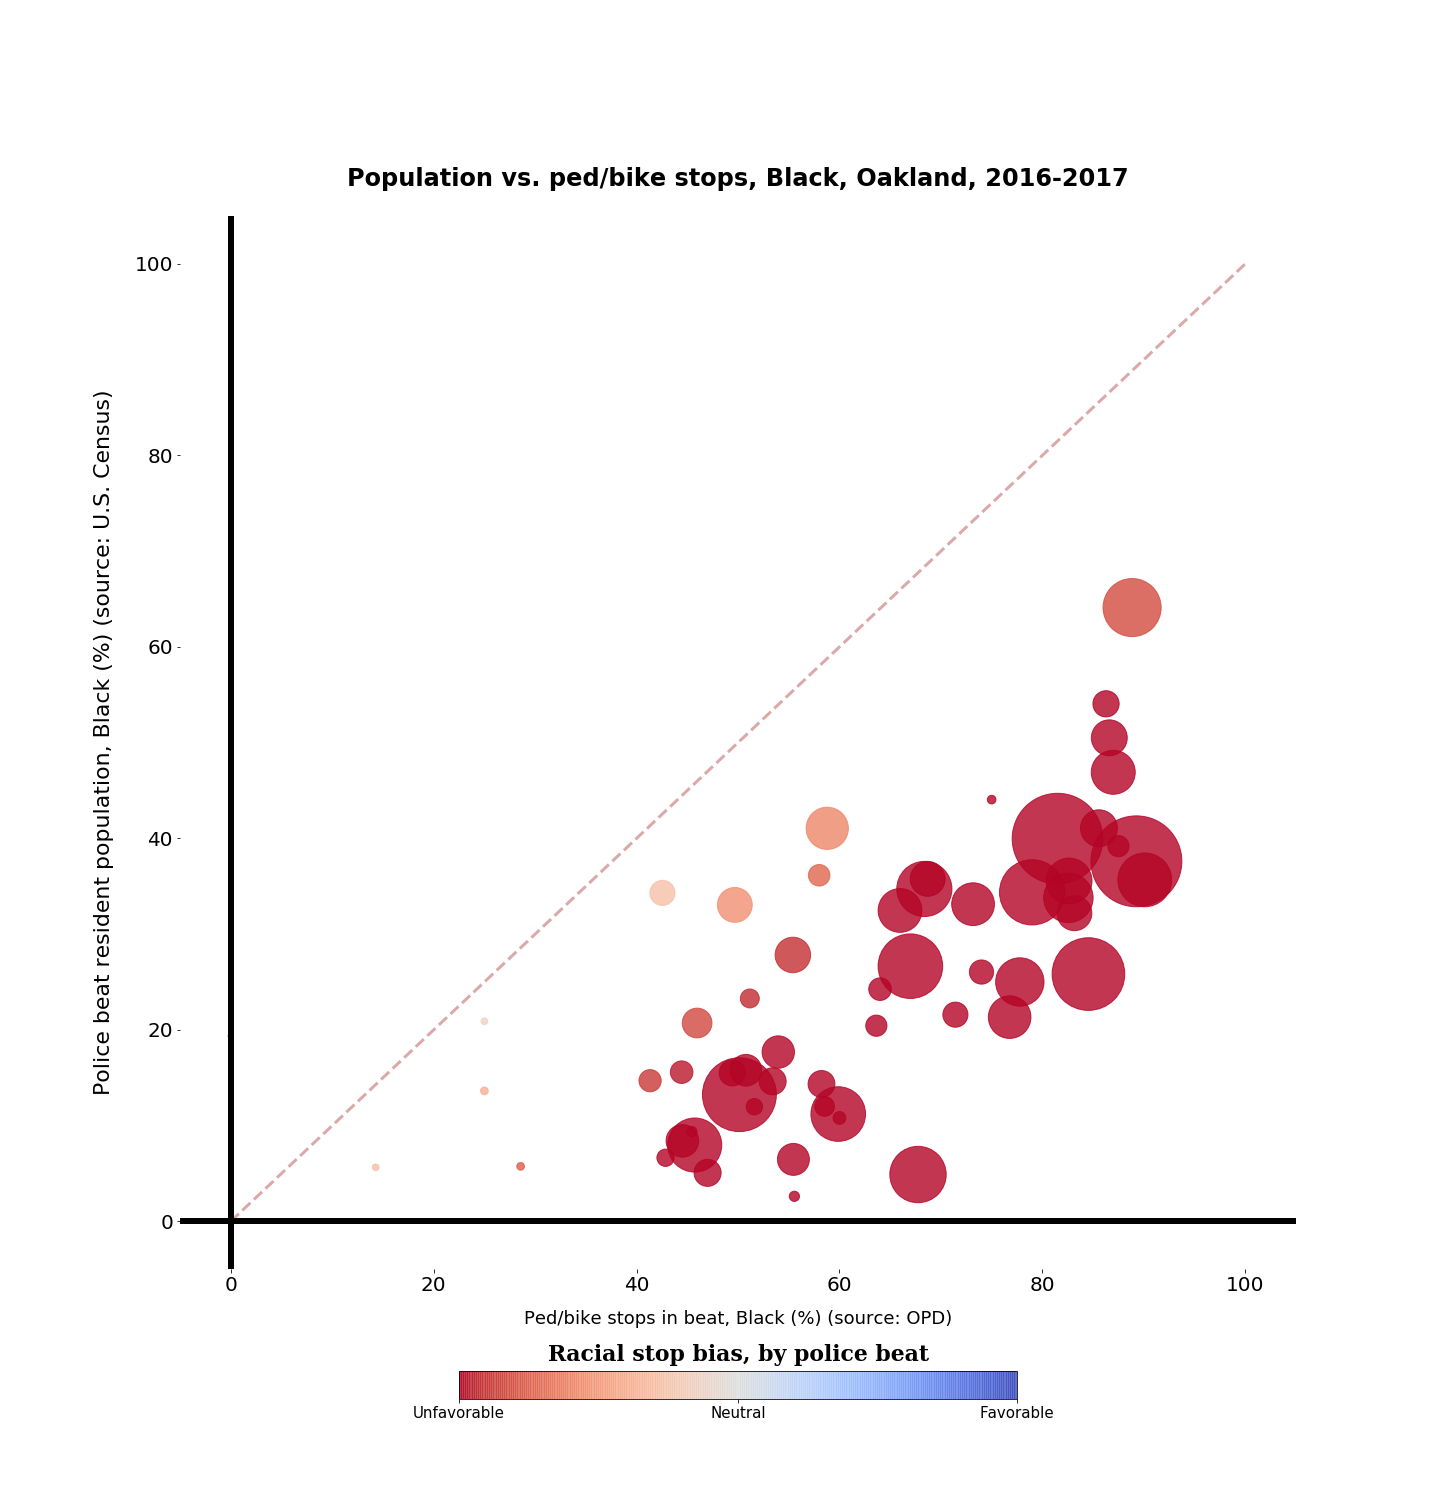
Biking while Black: Racial bias in Oakland policing
Scroll to Top