In my series on neighborhood change along streets named for Dr. Martin Luther King, Jr., Washington, D.C.’s Anacostia neighborhood was identified as notable. Between 2000 and 2017, Anacostia saw Black population increase, while median income also increased. That unusual pattern could represent development without displacement, the Holy Grail of community and economic development. We know how Black and brown communities have been harmed by redlining and other racist policies, but few cities have managed to reinvest in those redlined areas while benefitting the communities which were originally harmed. The places where reinvestment might be working should be investigated. The bicycle is the Bike Lab’s preferred data-gathering tool, so on a visit to DC, I had to roll through the neighborhood to get a better sense of it.
First, I had to clean up the data analysis. The original project, done on data from 2017, was at national scale, and I hadn’t looked at how the algorithm selected tracts on a city-by-city basis. In DC, it had included two census tracts on the north side of the Anacostia River near Capitol Hill, which I don’t think anyone would consider as being part of the neighborhood. I excluded those tracts, re-ran the analysis, and updated to the 5-year ACS estimates from 2023. (I would have used 2024, but our fascist regime has not yet published the 2024 ACS data).
With those adjustments, the initial finding stands for 2017, but, sadly, not for 2023.
| 2000 | 2017 (5-year) | 2023 (5-year) | |
|---|---|---|---|
| Median income (2025 $) | $23,292 | $38,037 (+63%) | $54,748 (+44%) |
| Black | 26296 | 28679 (+2383) | 24727 (-3952) |
| White | 572 | 1131 (+559) | 1340 (+209) |
| “2 or more” | 367 | 365 (-2) | 1739 (+1374) |
Between 2000 and 2017, inflation-adjusted median income rose by over 60%, while absolute Black population rose by over 2000 residents. That’s a remarkable result given the structural barriers. But between 2017 and 2023, median income continued to increase, and the displacement of the Black community began. The Black population dropped by 13.8% since 2017, and is now 6% lower than it was in 2000.

Interestingly, new residents in the past 6 years predominantly identify as “2 or more races”; the White population has increased, but not nearly as much. It is possible that some of the decline in Black population is a result of people previously recorded as Black now being recorded as “2 or more races”; there’s no real way to examine that. Washington, D.C. has a large population of foreign nationals, which may also contribute to this phenomenon.

The increase in median income is not spatially aligned with the decrease in Black population; the strongest increase, over $50K/year in fixed 2025 dollars, came in the center of the neighborhood. The southeastern part of the neighborhood, near Goose Island on this map, had very little increase in median income, and the largest drop in Black residents. Much of the housing there is HUD projects, so part of what may be getting measured here is a shift in the demographic of who is living in the projects.
Previous Bike Lab analysis of two other gentrifying neighborhoods (the Mission District in San Francisco, and Pilsen in Chicago) found that additional housing construction was leading to de-densification. That pattern is also is found here. Since 2017, 1190 net housing units (+8.8%) have been added in Anacostia, while the population has fallen by over 2000 residents (-6.6%). Be very skeptical of any claims that new housing construction will increase density in Black and brown neighborhoods.
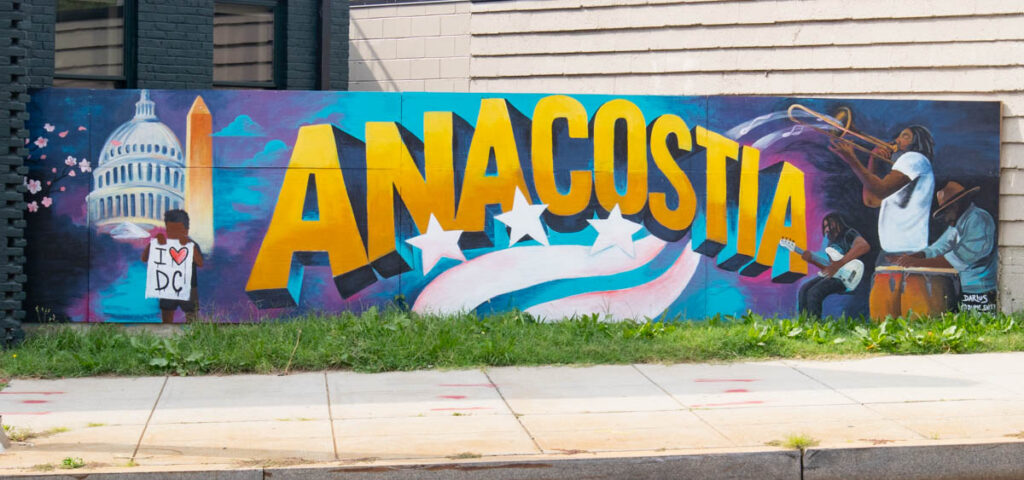
Experientially, riding and walking through Anacostia, I didn’t see any white people except in the part of the neighborhood adjacent to the bridge to Capitol Hill. And I saw plenty of evidence of an organized community fighting displacement and erasure, most notably at the spectacular Go-Go Museum & Cafe.

Go-Go music has been a feature of D.C. culture, especially in Anacostia, for almost 50 years. First innovated by Chuck Brown in the mid-70s, the form started with funk and disco rhythms, then added in Latin beats. Shows are very interactive, with a lot of audience call-and-response, and songs can last 10-15 minutes, as the band repeatedly goes into drum and conga breaks before coming back to the tune.

Ask anyone from D.C. about Go-Go, and they’ll tell you how important it is to the culture of the place. So in 2019, while this gentrification pressure was being felt in Anacostia, Go-Go became the center of a major mobilization. when a cell phone store which had played Go-Go music outside started to get noise complaints from new residents. The community responded with the “Don’t Mute DC” movement.
The band Rare Essence has been part of the Go-Go scene for decades, and a number of its members and their friends got together to organize a set of anti-gentrification street performances, which led to a tribute at the opening of the BET Awards later that year.
The Go-Go Museum & Cafe is their current project. It opened in February 2025, with listening stations and interactive displays, and two stages for live performance. Its focus is on Go-Go’s social and artistic importance in the Black community, in a city which was once over 70% Black.
In addition to the Don’t Mute DC movement, another anti-erasure action detailed at the museum is the community response to “I Am Not A Tourist,” a 2018 promotional campaign from Washingtonian Magazine which highlighted a number of D.C. social media influencers, none of whom were Black. After the community organized, the magazine had to retract the piece.

When we visited, a number of the museum’s founders and curators were there, and they were excited and joyful to share their music and their history with us. Really a highlight of our whole trip.
Washington, D.C., like Oakland, has a strong enough Black community to resist some of the effects of racial capital, and to carve out a space for what remains of the culture. Efforts like Don’t Mute DC and BBQ’ing While Black are important pieces of the struggle.