Author name: tom

Map output

It’s not entirely perfect yet, but I have a workflow which generates these maps right out of Python for all of my cities, with some provision for longitudinal comparisons. To do still are to deal with projection issues (they’re all in “web Mercator” because that’s what Leaflet uses), and centering issues caused by inconsistencies between folium, selenium, and PhantomJS. And to improve legends and captions. But it’s pretty cool, if you ask me.

Auto-generating maps

I’m working on scaling up the data analysis from the thesis, and I’m making some good progress, thanks to Folium. I’m pretty close to being able to run this on an arbitrary number of cities: just need to make the code a little more robust.

Whoops

I’ve been working on generalizing my code so that I can make comparisons for dozens (or hundreds) of cities. And of course, I’ve found a ton of bugs, mostly related to my own poor understanding of Python data structures and functions. But I also found a fundamental issue with the calculations I used in my thesis.

Distance thresholds

After looking at the job connectivity maps, I was curious to explore the idea that densities above a certain level led to walking more than cycling. I don’t have enough data to make a definitive statement, but I did find an interesting phenomenon related to connectivity in Columbus. Columbus has three disconnected zones where jobs are very close, broken up by areas of low job access.

Image depicting river systems with three different drainage densities (fine, medium, and coarse)

Intersection density

OSMnx makes it easy to generate statistics on street networks. Again these aggregated stats show very strong correlations, especially between bike mode share and intersection density. One of the problems of cycling advocacy is that there’s often not much that can be done to change this indigenous condition.

Density = destiny?

One striking result from the target area analysis is the correlation between residential density and cycling rates in the target area. For these four data points, the correlation between density and bicycle mode share is dramatic (r=0.97), which seems to speak to the importance of indigenous conditions in people’s mode choices. Unfortunately, the effect disappears when examined at the census tract level.

Maps of network connectivity to jobs

One of the factors I’m trying to measure in valuing facilities is their usefulness; do they actually go where utility cyclists want to ride? One of the factors I used was access to jobs within 1.5 miles along the cycling network. These maps really visualize the differences in density of the street networks.

Maps of commute biking and value-added facilities

Combining my concepts of target area and value-added facilities, I developed maps for each city which select the circle of census tracts near the central city which have the great number of commute cyclists.

One thing that’s visibly notable is the relatively weak connection of value-added facilities to cycling rates; only in Columbus are they well-connected. Part of what I conclude is that cultural factors and the indigenous qualities of the street network are more important than value-added facilities in cycling mode choice.

The methodology is potentially interesting for other kinds of analysis; you could easily optimize for any other census data.

Thesis

I’ve been too busy with thesis work to post any updates here, but now it’s actually done! And I’ll have some time to start sharing bits of it.

The most common reaction I’ve gotten from bike-identified people I’ve shared the work with is, “that’s interesting, I haven’t thought about it that way before,” which I will accept as an indication that the project has been successful.

Bike mode share, facilities, and crashes within 4-mile radius circle in central Austin (1:100,000)

Target area data analysis

One problem I noticed while doing field research is that the city extents vary greatly; Austin, for example, has over six times Minneapolis’ land area, which means that Austin includes some sprawling, low-density areas with low cycling rates that are excluded from Minneapolis’ mode share numbers. I looked at creating a 4-mile radius circle to encompass the highest-cycling area of each city (by ACS mode share data), to be able to develop more comparable metrics from city to city. There are still a lot of issues with the data, but at least I’ll be comparing rotten apples to rotten apples.

Roads vs. streets

Urbanists like to distinguish streets from roads. The somewhat distasteful neo-liberal conception is that roads exist to connect productive places, and streets exist as a platform for building wealth. A similar dichotomy exists with bike infrastructure; bike roads get us from place to place efficiently, and bike streets are interesting places to be.

Scioto River Valley

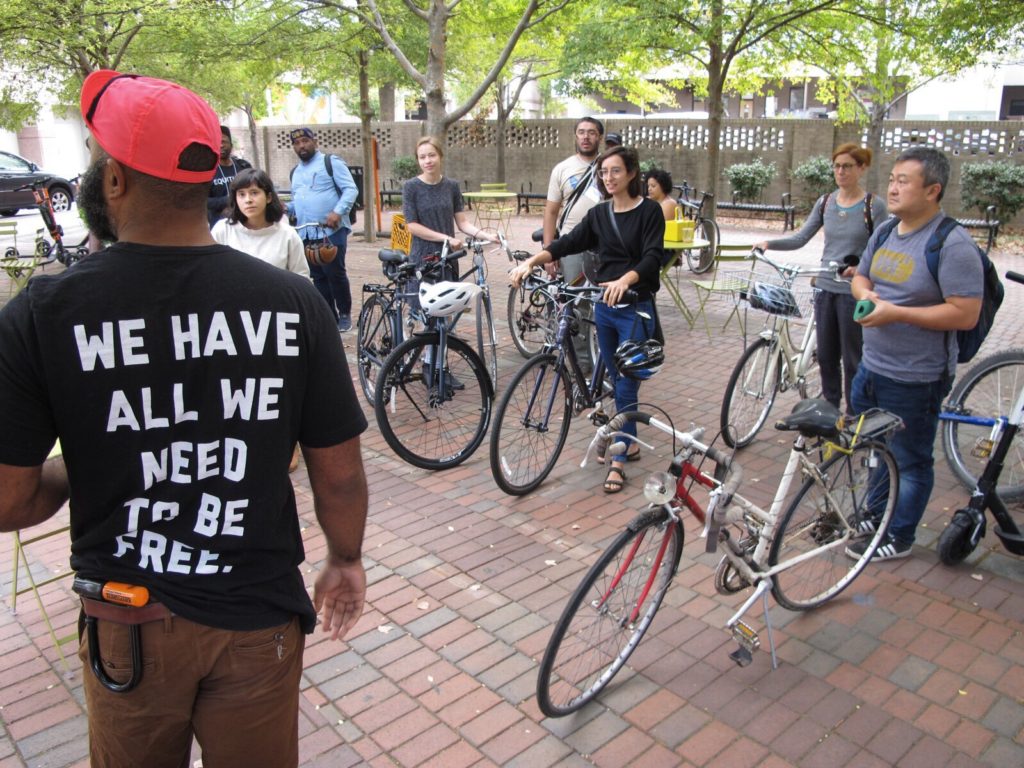
Columbus is the host of the Tour of the Scioto River Valley (TOSRV), one of America’s longest-standing large group rides. TOSRV makes the claim, with some credibility, that its popularity led to the original U.S. bike boom back in the 1970s. So, social riding is part of the culture around Columbus, and I was able to hook up with the regular Tuesday night social ride. The leader of the ride, Ray George, is one of the founders of Yay Bikes!, and he was more than happy to talk about the organization.

Subaltern cyclists

Heading towards downtown Columbus from Old Towne East, you see a tall building with a sign that reads “Motorists,” which seems to emphasize the transportation hierarchy in town. There seems to have been some nasty conflict between bike groups here, and one thing we know about subaltern groups is that there is a tendency towards infighting and competition amongst themselves. Instead of banding together to fight for their interests, they can fall into disputes over goals and methods–especially, whether to work within the system or to disrupt it.

Typical street in Old Town East

Indigenous bikeways

I’m thinking of using the term indigenous instead of natural to describe the existing infrastructure of a city prior to the construction of any bike-specific facilities. The OED defines indigenous as “Originating or occurring naturally in a particular place,” which I think captures the idea I want to get across. Indigenous bikeways aren’t entirely natural, but they exist (or don’t) based on decisions that were made decades or centuries ago.

The term also has a slightly unsettling connection to colonialism which I actually think is good, because I think urbanism often has a slightly unsettling connection to colonialism, or more specifically Orientalism.

And I happened to be visiting a city named for America’s favorite colonialist.

Bikeway taxonomy

There have been a number of different attempts to categorize bikeways based on different criteria, some related to the facility design, some related to its users. I’m not really happy with any of them. I’m working on developing a taxonomy that could improve our discussions about bike facilities.

Wrapping up the Twin Cities

I did a ton of riding in the Twin Cities, largely thanks to my friend Max who provided both a nice bike and a whole lot of guidance on where to go. People who race alleycats know a lot about how to get around the city. I totaled over 300km, and hit almost everywhere I needed to get a sense of Minneapolis and St. Paul.

streets.mn

The Twin Cities have a strong urbanist community, symbolized by the active streets.mn blog. There’s a ton of interesting content there. Several people had suggested that I should meet Bill Lindeke, one of the blog’s regular contributors. Bill describes himself as an urban geographer; in addition to writing on a broad range of subjects for streets.mn and for the Minneapolis Post, and sitting on the planning commission for St. Paul, he organizes walking and biking tours which highlight different aspects of the historical or current city.

Midtown Greenway

I’ve mentioned the Midtown Greenway a few times, and it’s worth talking about it because it’s really quite an impressive facility. I did a bike count there, and my notes from that day say, “If you want to feel better about the future of the world, go sit on the Midtown Greenway for two hours.” But context matters; its success isn’t easy to duplicate.

North Minneapolis Greenway

North Minneapolis is a majority-minority district, with African-Americans (43%) being the predominant race. The typical hallmarks of disinvested ethnic districts are found there; decaying infrastructure, fewer trees, poorer schools, and higher crime rates than the rest of the city.

Inspired by the best bike facility in town (the Midtown Greenway, an impressive rails-to-trails conversion of a multi-track trenched railroad), a number of groups have been working for five years to convert some of the low-traffic street infrastructure of North Minneapolis into a greenway.

Unfortunately, skepticism among the neighbors and missteps during the outreach process have made the temporary installation acrimonious and disruptive.

Women on Bikes

There has been a fair amount of research done on the “gender gap” in cycling; men bike more then women, though because our data suck we don’t know exactly how much. Different studies show gaps as low as 57-43% or as high as 75-25%. But everyone agrees that women are less likely to bike, and are more likely to be concerned about the safety of the roads they use.
Biking uber-pundit Jennifer Dill (Portland State) did a great study on revealed route preferences of cyclists in Portland that showed significant gender differences in willingness to accept longer travel distances in exchange for a more pleasant (or perceptually safer) route.

Scroll to Top