My posts earlier this year suggesting that Vision Zero’s communications strategy of amplifying safety risks might be counter-productive to its goals received a little bit of attention. I would characterize the responses as falling into three categories:
- Defensiveness
- Genuine interest
- Strong endorsement
Bike advocacy does not handle criticism well, and knee-jerk defensiveness is a typical response. For example, several people argued that Vision Zero’s advertising strategy doesn’t matter because no one sees the advertisements or is influenced by them. I’m used to that kind of silliness and I don’t bother engaging with it unless there are substantial issues raised. (And there were a couple, which I’ll address in a moment).
Some advocates were more thoughtful, and at least acknowledged that my points were interesting. Amplifying safety risks, they point out, is designed to build political influence, not to influence prospective cyclists. Many had not considered the implications of a combative, risk-based approach, and at least were open to considering the consequences.
The most enthusiastic responses were from people in the cycling world who, like me, are uncomfortable with these rhetorical tactics. I am personally uncomfortable with the moralistic framing of streets advocacy, I’m uncomfortable with appropriating language from anti-violence campaigns, and I’m uncomfortable with adopting the tools of social protest. My own advocacy philosophy has always been to frame cycling as a pleasant, normal, accessible activity. I heard from a number of other folks, many higher on the food chain of bike advocacy than I am, who have similar philosophies and are similarly uncomfortable with mainstream Vision Zero tactics.
The loudest silence was from Vision Zero itself. I know that a number of VZ leaders saw my posts, but I don’t think I got a single response from anyone with VZ in their job description. That’s a symptom of advocacy’s resistance to criticism, but also of VZ’s valuing of political capital; I’m not important enough to respond to. [I note that analytically, not petulantly.]
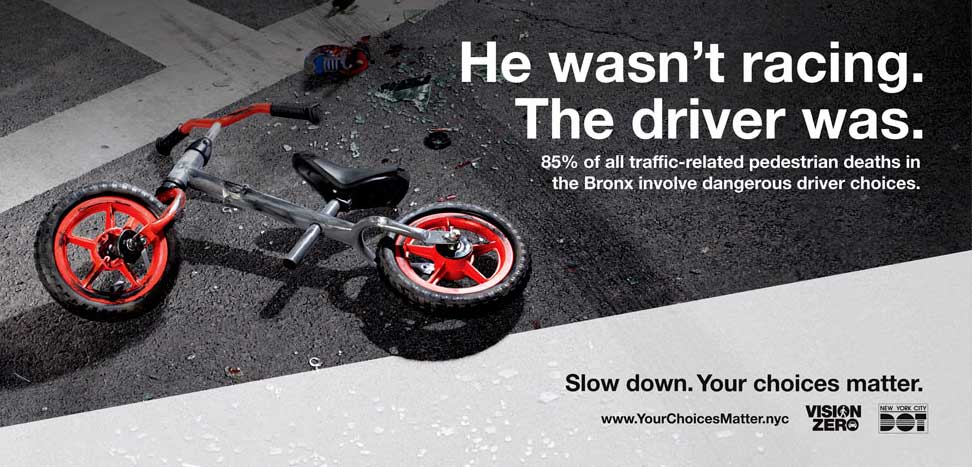
I’m going to leave this ad here as an example of the kind of thing I am uncomfortable with. This is part of an actual Vision Zero ad campaign, which had billboards all over New York, and which was cited by VZ as an effective example of communications strategy. I’m leaving out the images from that campaign which showed dead bodies in the street with blood running down their arms.
Does that make you want to ride your bike in the city? Or encourage your kid to?
Revisiting the analysis
In October we got the 2018 data from both the American Community Survey (ACS) and the Fatal Accident Reporting System (FARS), so I wanted to revisit the analysis and add those data points.
There were two methodology criticisms of the original study which I wanted to address. One is that the study lacked a comparison group. That’s a valid point, so back in April I did my best to select nine sort-of-similar cities who have not adopted Vision Zero, and re-ran the same analysis on them. As I noted in the linked post, this is not a true control group, or even a very good comparison group, because most of our largest cities have adopted Vision Zero, leaving little else to choose from. But it’s the best I could do.
The other issue is that the ACS 1-year estimate data is very noisy (unavoidably so) and that I’m normalizing the graphs to a point in the noisy data. Fair point. Fortunately there’s a way to improve the baseline, which is to use the 5-year estimate data for the baseline year, which makes the results a little less subject to randomness.
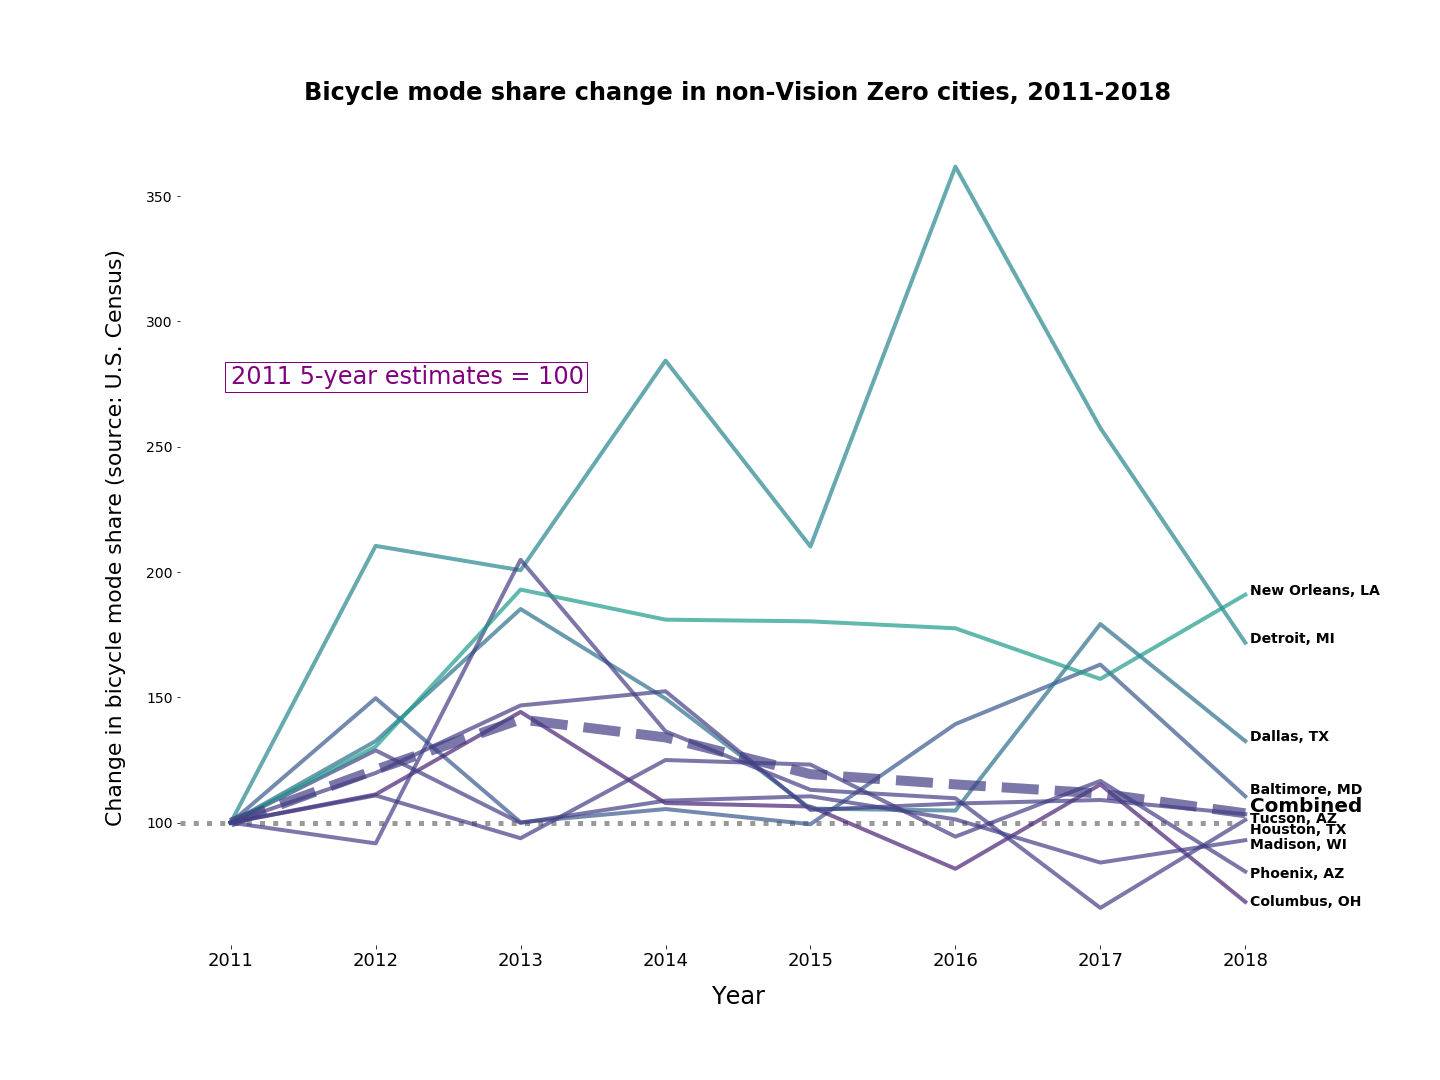
Using the 5-year estimates does introduce another problem, which is that those estimates can be trailing indicators. If the data has a strong multi-year trend, a baseline using the 5-year estimate will lag the reality. This can be seen most dramatically in the chart of 2011-2018 mode share data:
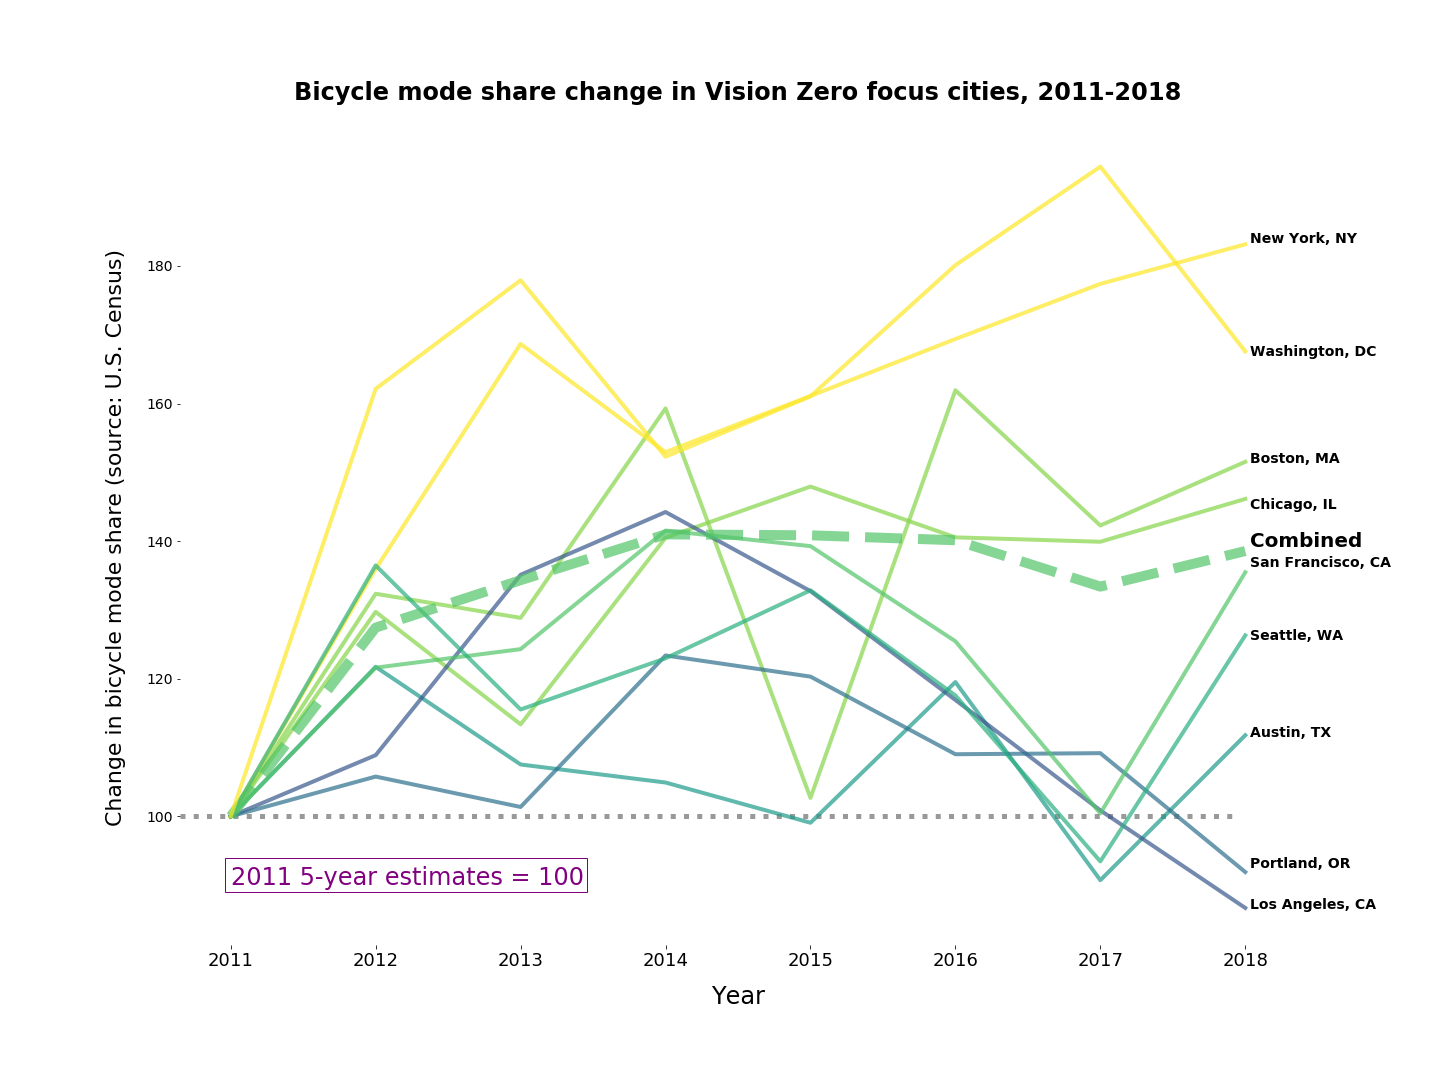
These cities gained a lot of commute cyclists from 2011-2014; overall cycling mode share rose by almost 40% in aggregate according to these numbers. This chart is using 1-year estimates for the 2014 data, which were the estimates I used for baselines in the initial study. The 5-year estimates for 2014 will provide a substantially lower baseline (probably 10-20% lower) because they’re using a 5-year decaying average which includes earlier years with less cycling. San Francisco, for example, in 2014 has cycling mode share of 4.4% in the 1-year estimates but 3.8% in the 5-year estimates. [Meta-note: The 2011 baseline in this chart has the same problem, because cycling was also rising in the five years prior to 2011. So this chart probably also overstates the rise in cycling from 2011-2014 by 10-20%].
In any case, I think this chart captures a generally accurate (though noisy) picture of a set of cities which collectively were gaining a lot of cyclists between 2011-2014, and have been more or less flat since then. The flatness coincides with their adoption of Vision Zero.
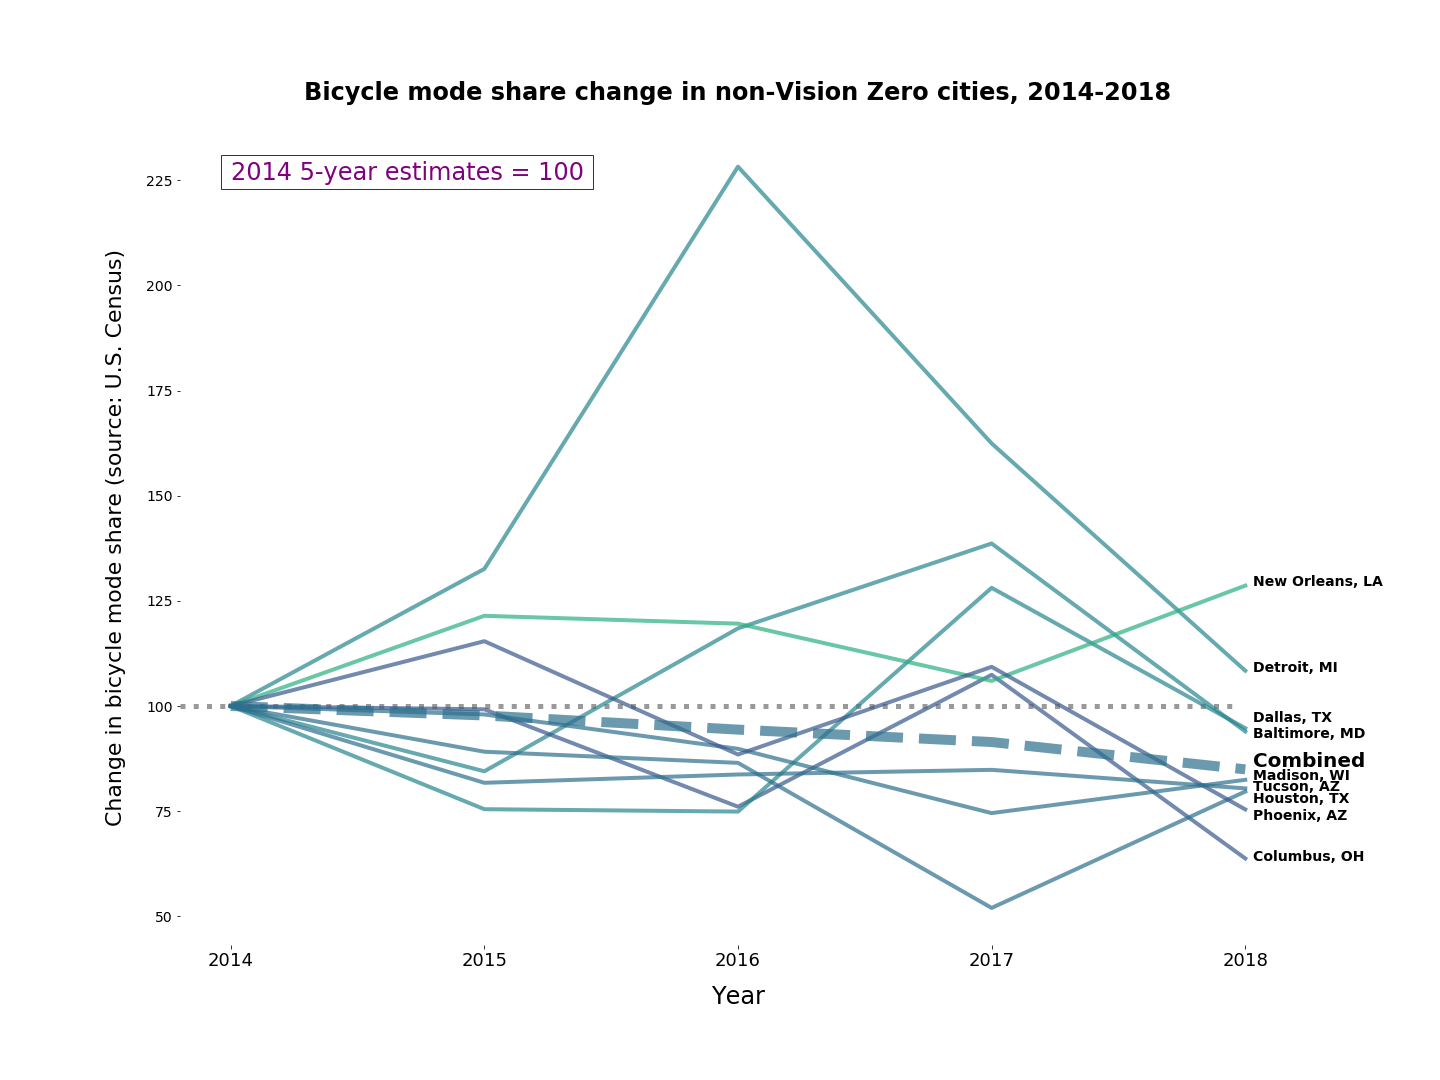
They are doing a bit better than the non-Vision Zero cities, however:
These cities saw much less of a cycling increase from 2011-2014, and have declined slightly since then, leaving them almost where they were eight years ago. (But Detroit and New Orleans are kicking some butt, at least).
When we look at just the 2014-2018 period, using the 5-year estimates for 2014 as the baseline, it looks a little better for Vision Zero, though the data caveats mentioned above apply:
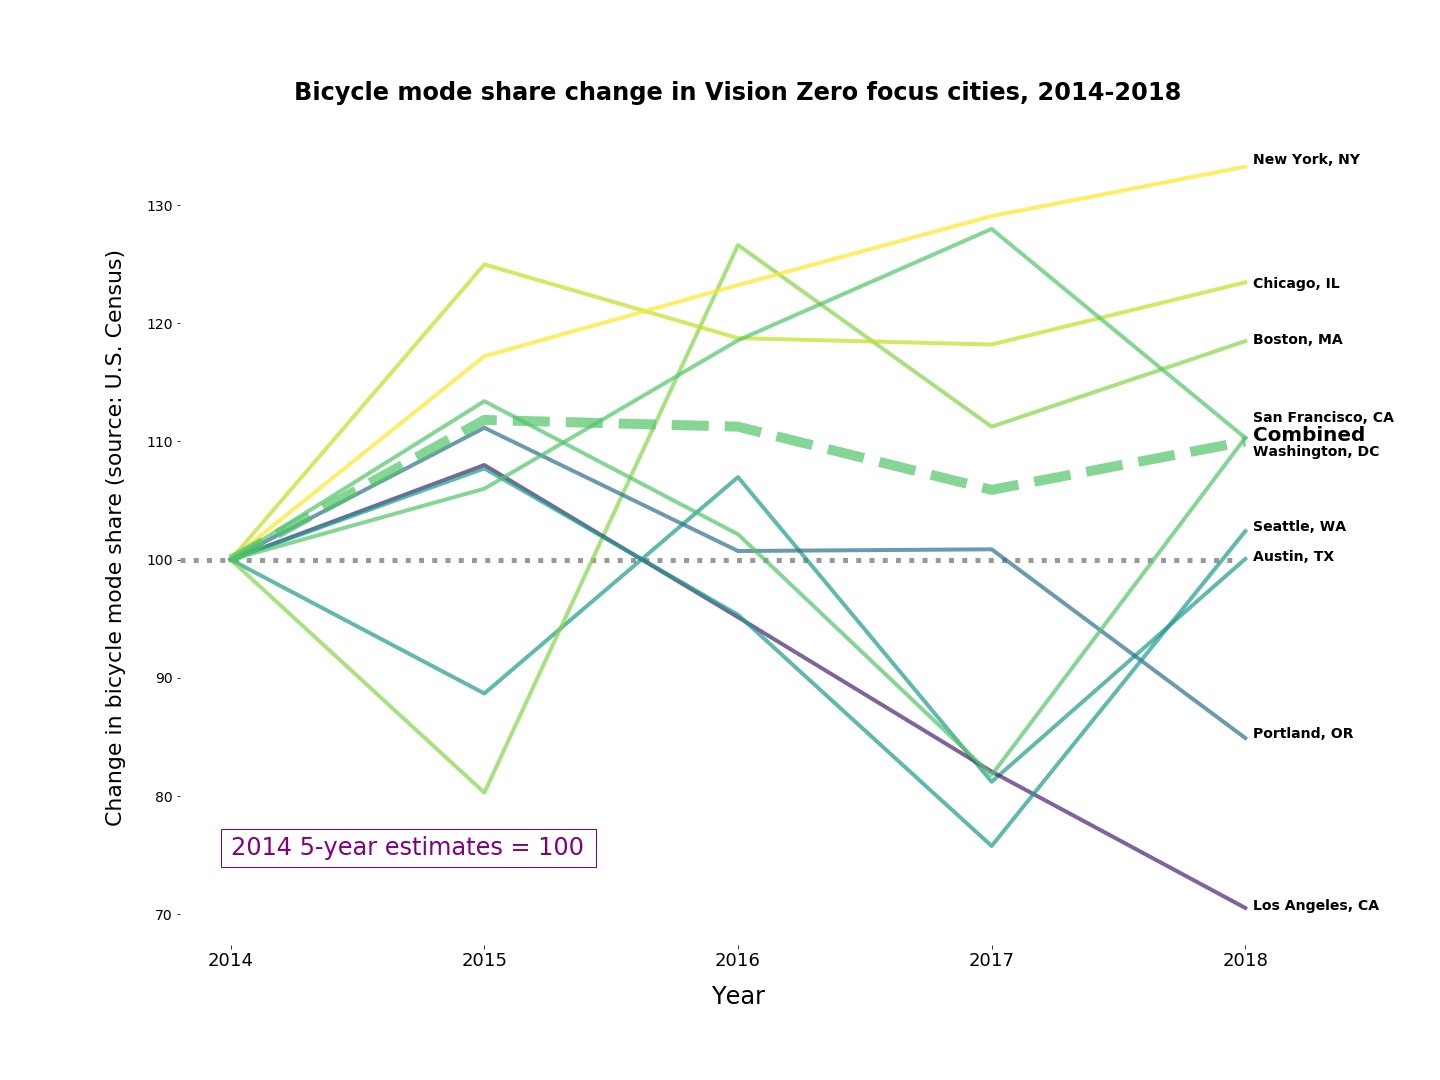
Using the 5-year estimate baselines for 2014, the Vision Zero cities managed about a 10% growth in cycling rates, though that may be illusory because of the lagging baseline. The non-Vision Zero cities by contrast combined to lose about 10% of their commute cyclists.
What about the fatality rates? Those don’t look good for either group.
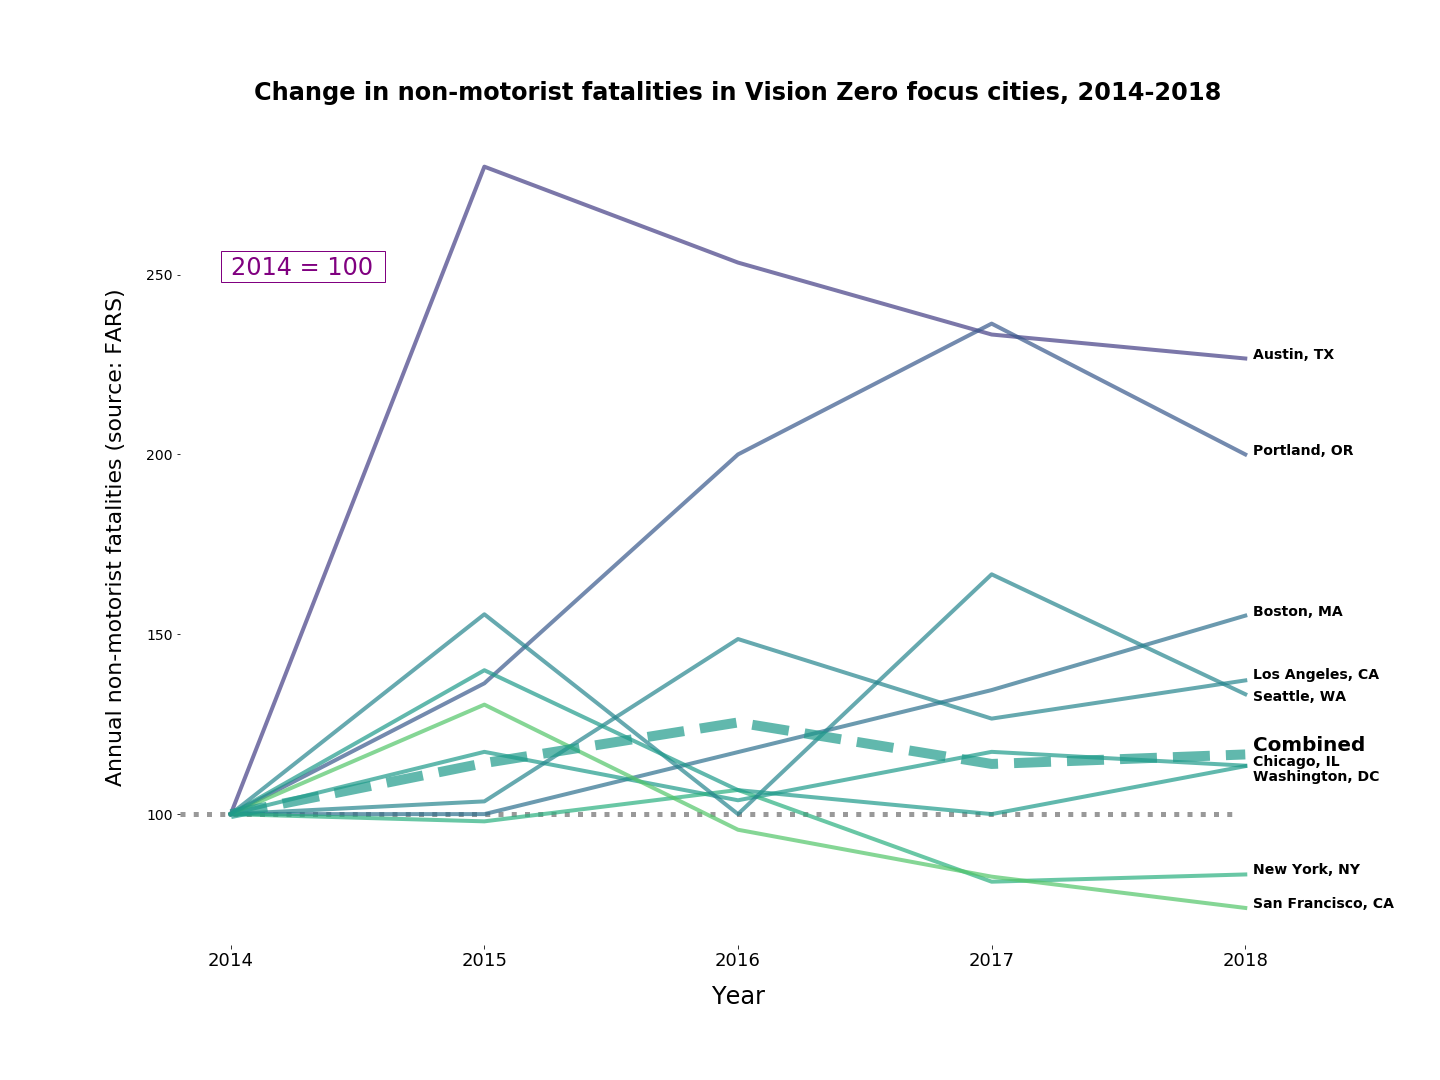
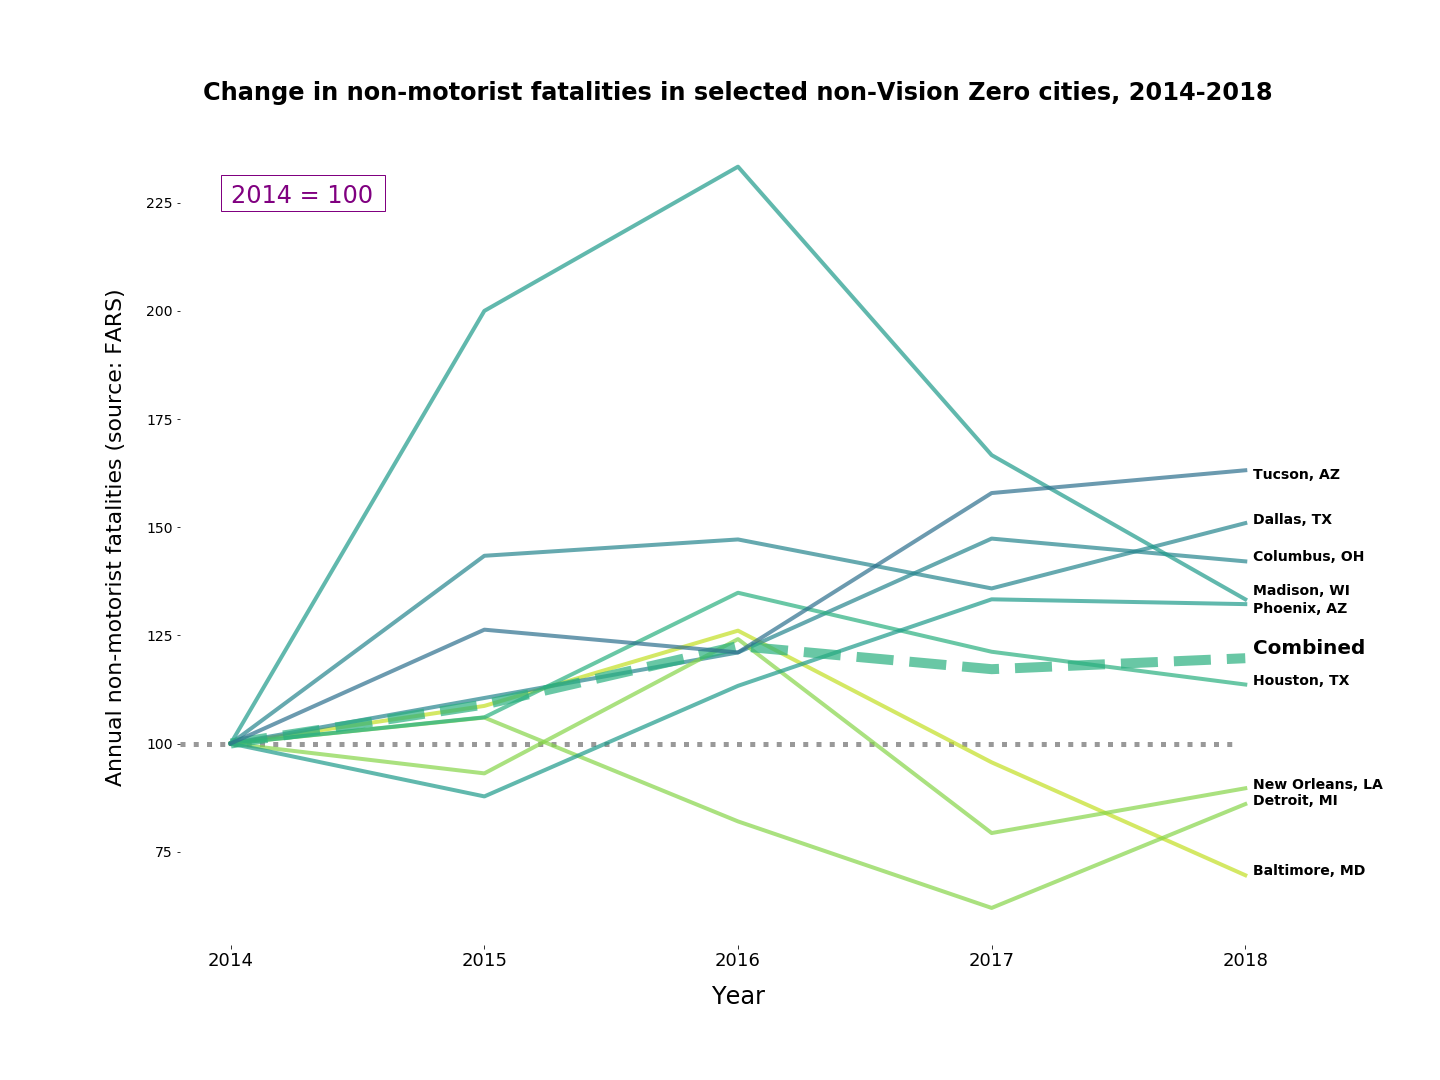
This is noisy data, especially in the small cities, but overall the graphs look more or less the same. Non-motorist fatalities rose in 7 of the 9 Vision Zero cities, and 6 of the 9 non-Vision Zero cities. And they’ve been higher in aggregate, every year since 2014, in both groups. And if you listen to what advocates are saying in 2019, it seems like they’re getting worse.
All of this fits with what the research has found about cycling infrastructure: looked at in its totality, infrastructure has a small, positive effect on cycling participation rates (Dill/Carr 2003, Krizek/Barnes 2006, Cleaveland/Douma 2008, among others), and ambiguous effects on overall safety (Klobucar 2007, DiGioia 2014, Beck et. al 2019). The Vision Zero cities appear to have done marginally better at avoiding declines in ridership, but have not done any better at making people safer.
Discussion
Vision Zero is founded on a moral assumption: that non-motorist fatalities represent failings of public policy. It is also founded on a design assumption: that Copenhagen-style infrastructure is the solution to traffic fatalities. Those assumptions lead to the conclusion that public officials who fail to install Copenhagen-style infrastructure are moral failures: negligent or evil.
While I was working on this post I saw a news report (a promotional piece about CicLAvia) which stated that LA has added 600 miles of bike lanes since 2010. BikinginLA, a bike advocacy blog, disputes that number, claiming there have only been 394 center lane miles. In either case, it’s a significant investment in infrastructure over time. Yet since 2011, cycling mode share in LA has dropped by over 10%, and non-motorist fatalities have risen by almost 50%.
The Vision Zero response is that even though we’ve added a lot of infrastructure, we haven’t added enough. Advocates proceed to attack officials who aren’t making it their highest priority. “Just in case you wondered why Vision Zero is failing in Los Angeles,” as BikinginLA puts it.
Frankly, I don’t think the data supports the idea that installing cycling infrastructure should be a moral imperative. I don’t think we are seeing the increases in cycling rates or the reduction in crashes which might make it so.
So, when we frame cycling infrastructure as a moral imperative—when we’re staging “die-ins” and installing memorial signs and mobilizing a Blocked Bike Lane Day of Action—it feels wrong to me. (And I don’t think I’m alone.) I think there are real moral issues related to cycling, so why are we focusing on infrastructure instead of, for example, People for Mobility Justice’s Mobility Justice Strategy: Thriving Communities, Professional Development, Building Power? Why can we get 500 cyclists out for an anti-bike ticket demonstration but only 25 for a Justice for Naj rally?
Why are we not addressing the principles of the Blackspace Manifesto, such as, “Be humble learners who practice deep listening” (among others)? Why are we not engaging with Oboi Reed’s Equiticity Racial Equity Statement of Principle: “Community Ownership, Local Innovation,” (among others)? When Lynda Lopez suggests that “I try to consider what context I’m missing from communities…it was important for me not to come into this meeting as someone who doesn’t live there…thinking I know better”, do we understand that that should apply to every meeting and every decision the city makes?
Cyclists are not an oppressed group. When we behave as if we are, we take up space which belongs to truly oppressed groups. Let’s think about what it means to support mobility justice for those.
Because what we’re doing now isn’t working anyway.