My post on Vision Zero’s threat amplification communications strategy got some interesting responses. I would describe one class of response as a sigh of relief, from advocates and city officials who feel embattled in the current climate because they don’t want to adopt such a confrontational style. (Or who are being actively targeted by its attacks). Maybe it’s just me, projecting, but I think there’s a real risk that potential allies are being set aside in this rush to pressure cities to build infrastructure.
Another class of response was an interest in comparison data; what happened in non-Vision Zero cities over the same time frames? An entirely reasonable question, and easy for me to research, except for the problem of finding comparable cities. Vision Zero includes the nation’s three largest cities (New York, LA, and Chicago), as well as most of the top cycling cities in the country. There isn’t really a comp for New York or Portland among non-Vision Zero cities. But it’s worth running some numbers, so I spitballed it, throwing in the remaining largest U.S. cities, as well as some higher-cycling smaller cities like Madison, WI and Tucson, AZ. I avoided secondary cities like Oakland, St. Paul and Tacoma, because the Vision Zero-style messaging of the main city is just as prevalent in the secondary city (at least here in Oakland). [Future post: Why are cycling rates in secondary cities so strongly correlated with cycling rates in the main city?]
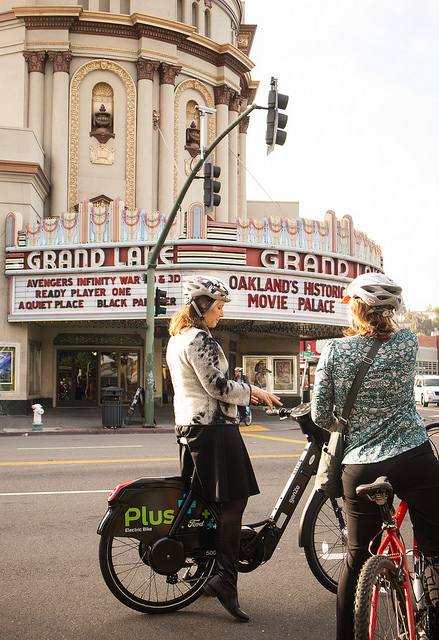
Here are the graphs for the selected non-Vision Zero cities, with one interesting caveat:
The non-Vision Zero group also saw an aggregated drop in cycling rates from 2014-2017. As with the Vision Zero population, three cities increased and six decreased. The aggregated drop was somewhat larger (16% vs. 5%), so an argument could be made that Vision Zero cities are doing better at retaining cyclists.
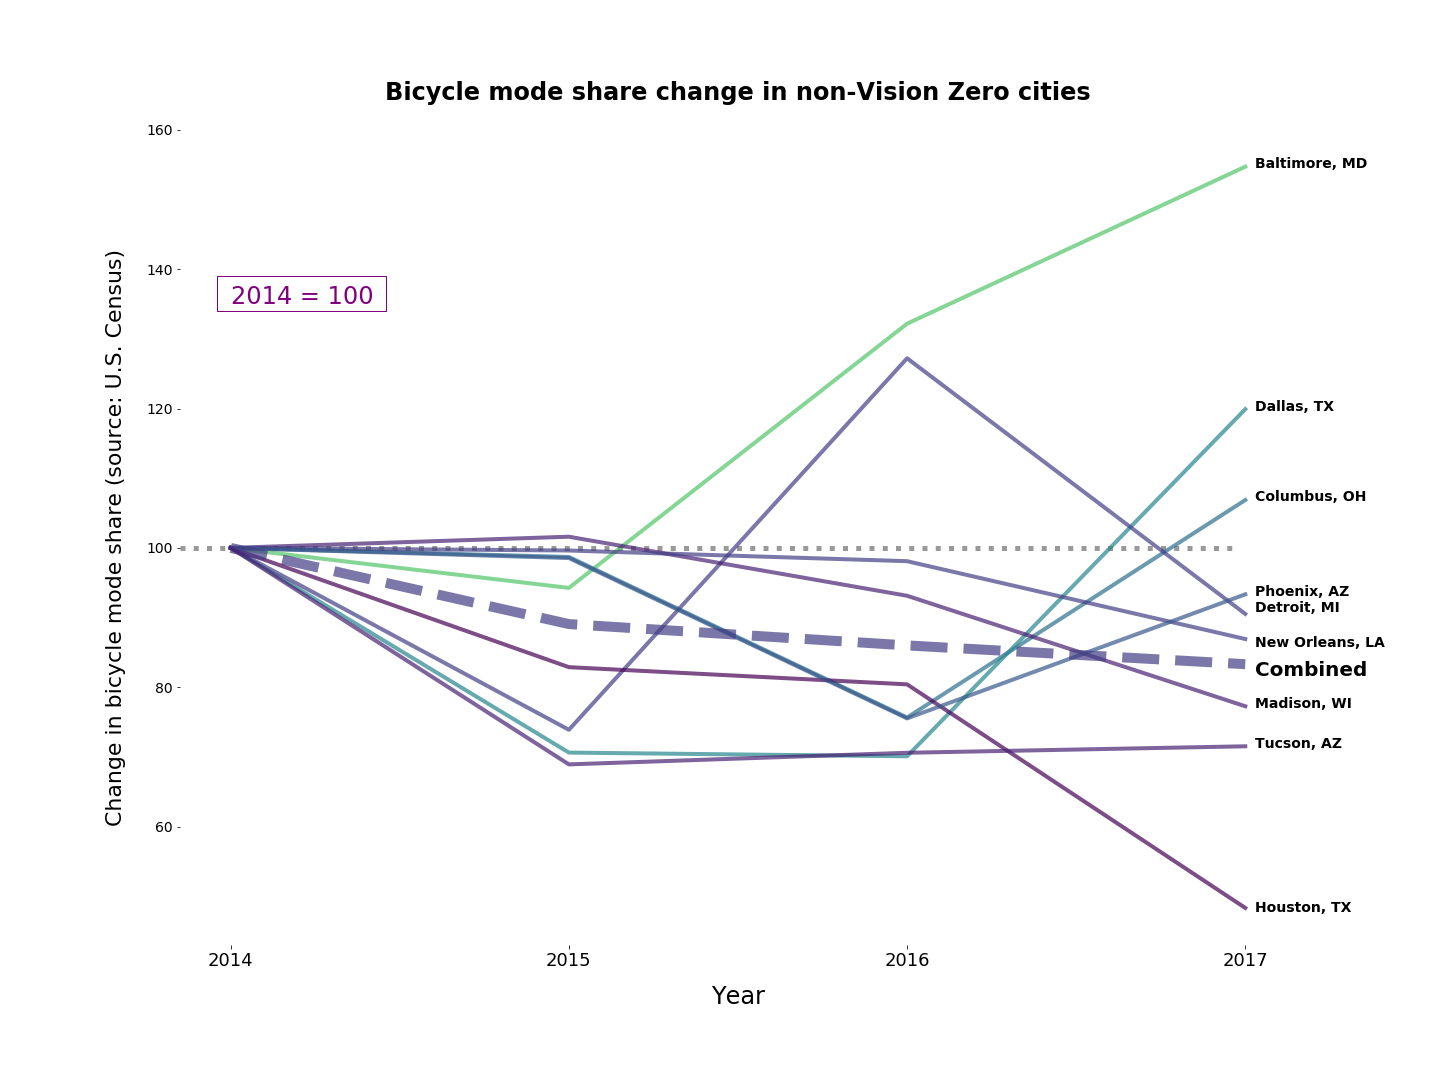
But, I think we’re well within margins of error here, which are very large for one-year ACS estimates. By the ACS data, the non-Vision Zero cities did better from 2011-2014, with cycling rates growing by 25% over that time frame (vs. 20% for the Vision Zero group).
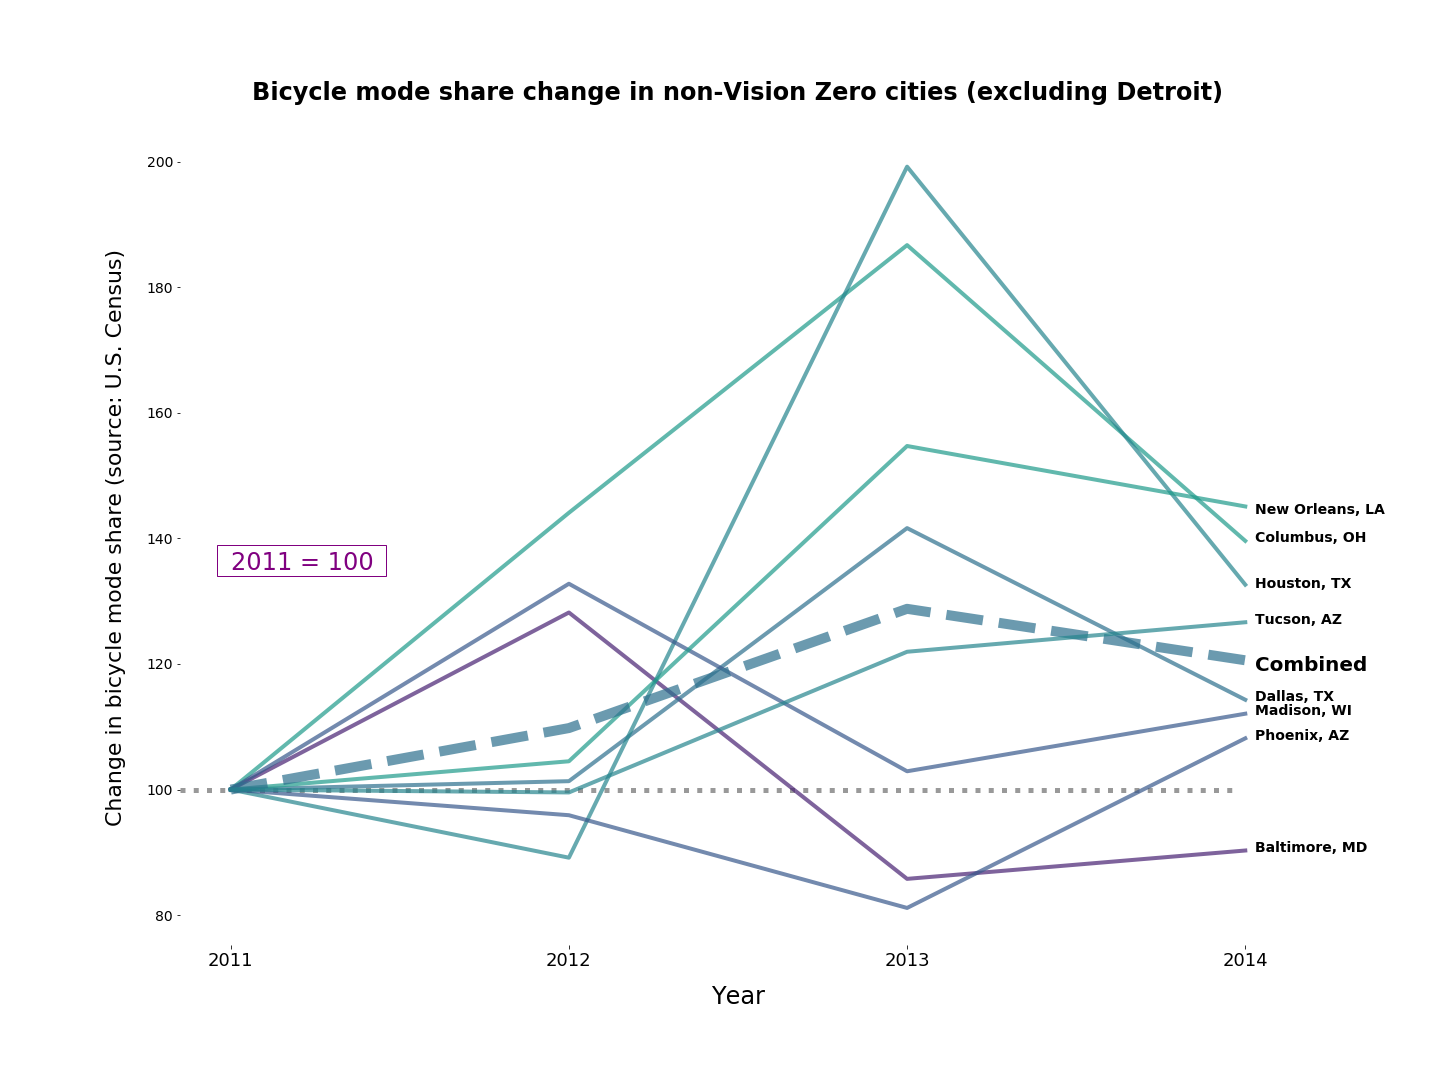
Here is the interesting caveat: I excluded Detroit from this graph because it’s totally off the chart from 2011-2014.
According to the ACS one-year estimates, cycling in Detroit grew by a factor of 12 between 2011 and 2014. A factor of 12! In just three years. Now, that was starting from nearly zero (0.06% mode share in 2011, among the lowest in the country). And it’s probably partly statistical noise, because the 2011 5-year estimates show the rate at 0.2%. But still, it’s a huge increase, by far the largest in either group. And of course, what was happening in Detroit at the time was the growth of Slow Roll: a social ride based on positive messaging and normalization of urban cycling.
One of the few strong findings of cycling safety research is that an increase in the number of cyclists in a city results in a decrease in crash and injury rates. This holds for this sample set, as Detroit and Baltimore (which saw the largest increase between 2014-2017) are two of the three cities which saw crashes drop over that time frame.
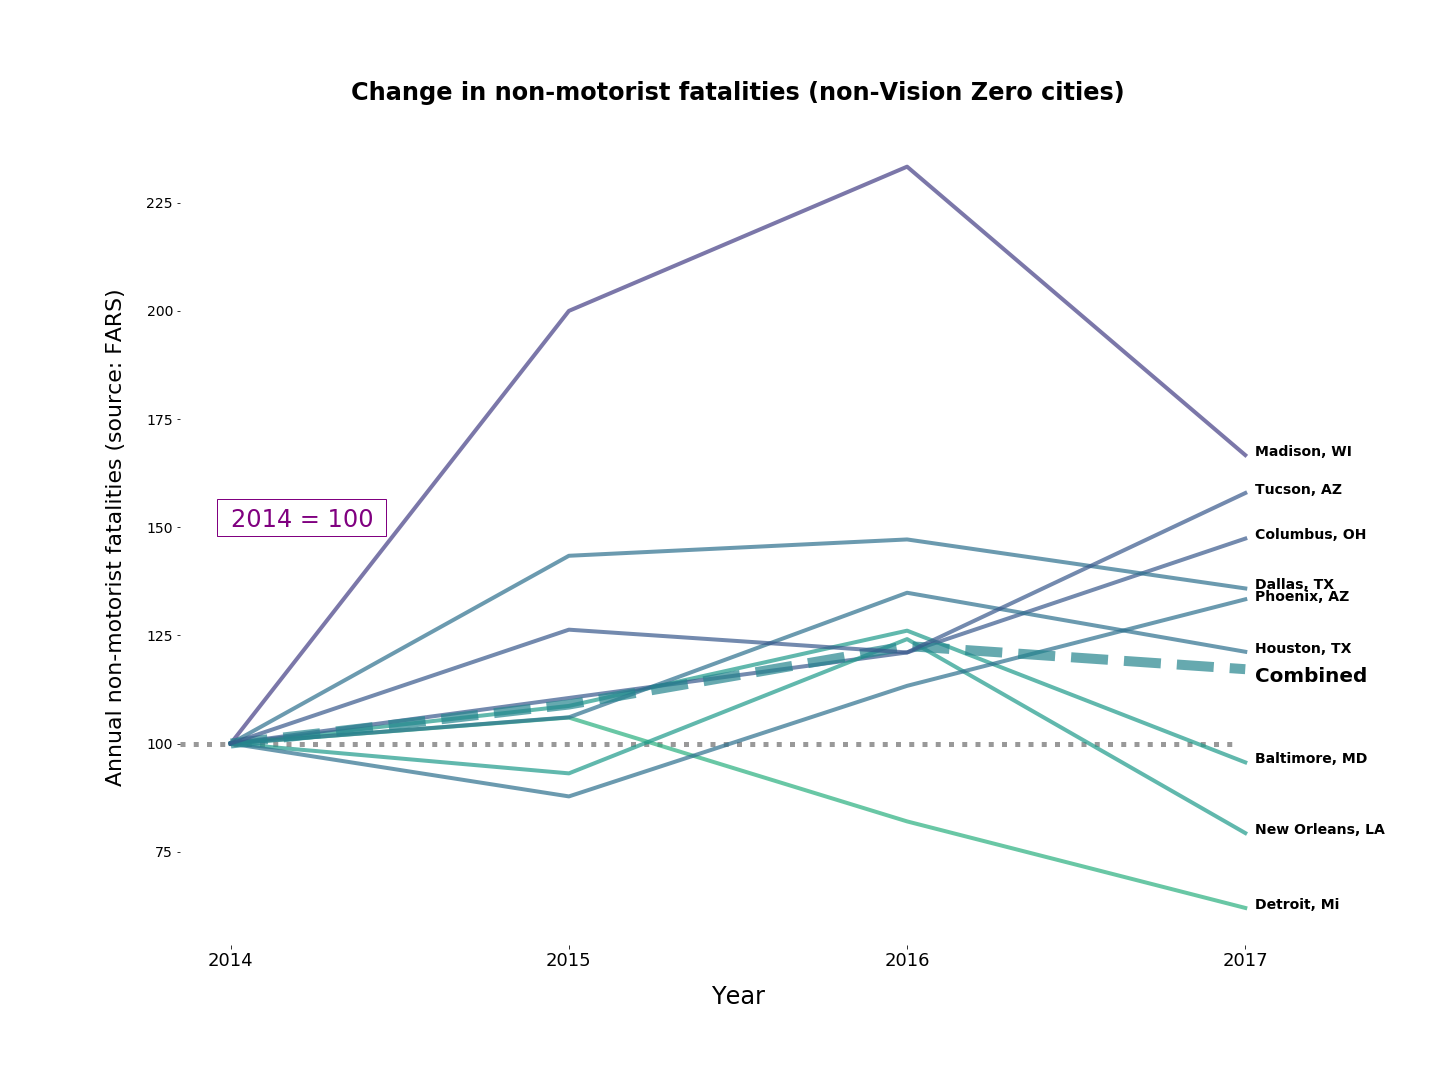
In aggregate, fatal crashes rose 17% among this group, compared with 13% in the Vision Zero cities. So again, there may be a small win for Vision Zero here, but it’s probably in the statistical noise.
My personal belief, and a hypothesis of the Bike Lab project, is that we do not do enough investigation of the importance of social cycling programs like Slow Roll, and that social factors are the biggest contributors to differences in cycling rates in different cities. A corollary, and subject of another future post, is that we’d probably have more impact on both cycling rates and road safety if we shifted marginal dollars into social cycling programs instead of focusing solely on infrastructure investments.