

Minneapolis, MN
Minneapolis, and its twin Saint Paul across the river, are amongst the most prosperous of the northern Midwestern cities. Saint Paul is the state capital, and Minneapolis houses the main campus of the University of Minnesota, with over 50,000 students. The different political structures and cultures of the Twin Cities provide many opportunities for comparison.
Thoughts from Minneapolis

Cycling and development
Andy Singer (who you may know from his “No Exit” cartoons) today posted on streets.mn about the possibility of re-purposing part of a railroad bridge across the Mississippi to extend the popular Midtown Greenway. For me, this resonated with my take-away from last week’s Mobility4All panel, of how bike infrastructure became associated with gentrification partly because the bike advocacy movement chose to pair infrastructure with economic development to gain political influence.

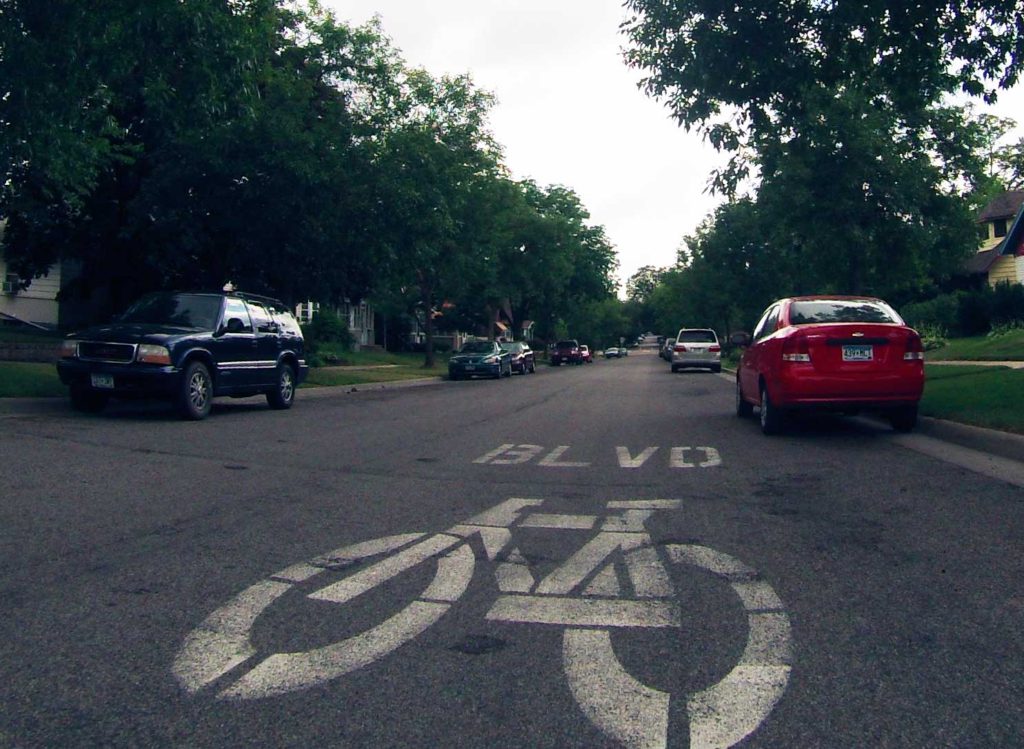
Roads vs. streets
Urbanists like to distinguish streets from roads. The somewhat distasteful neo-liberal conception is that roads exist to connect productive places, and streets exist as a platform for building wealth. A similar dichotomy exists with bike infrastructure; bike roads get us from place to place efficiently, and bike streets are interesting places to be.

Wrapping up the Twin Cities
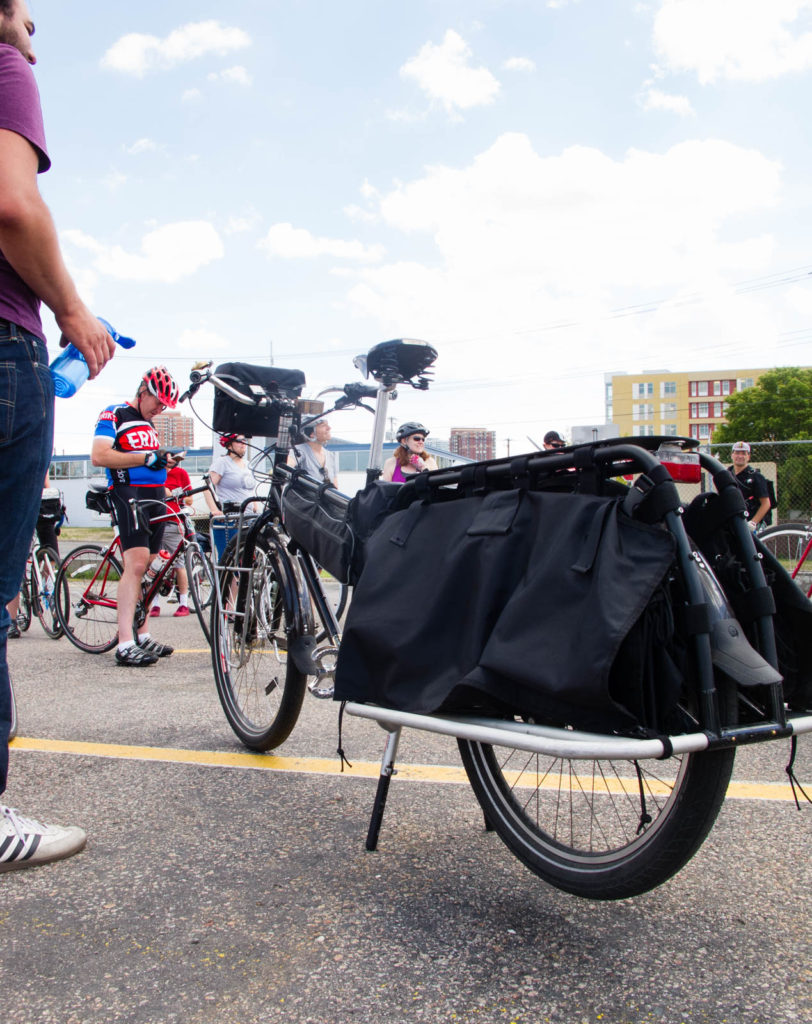
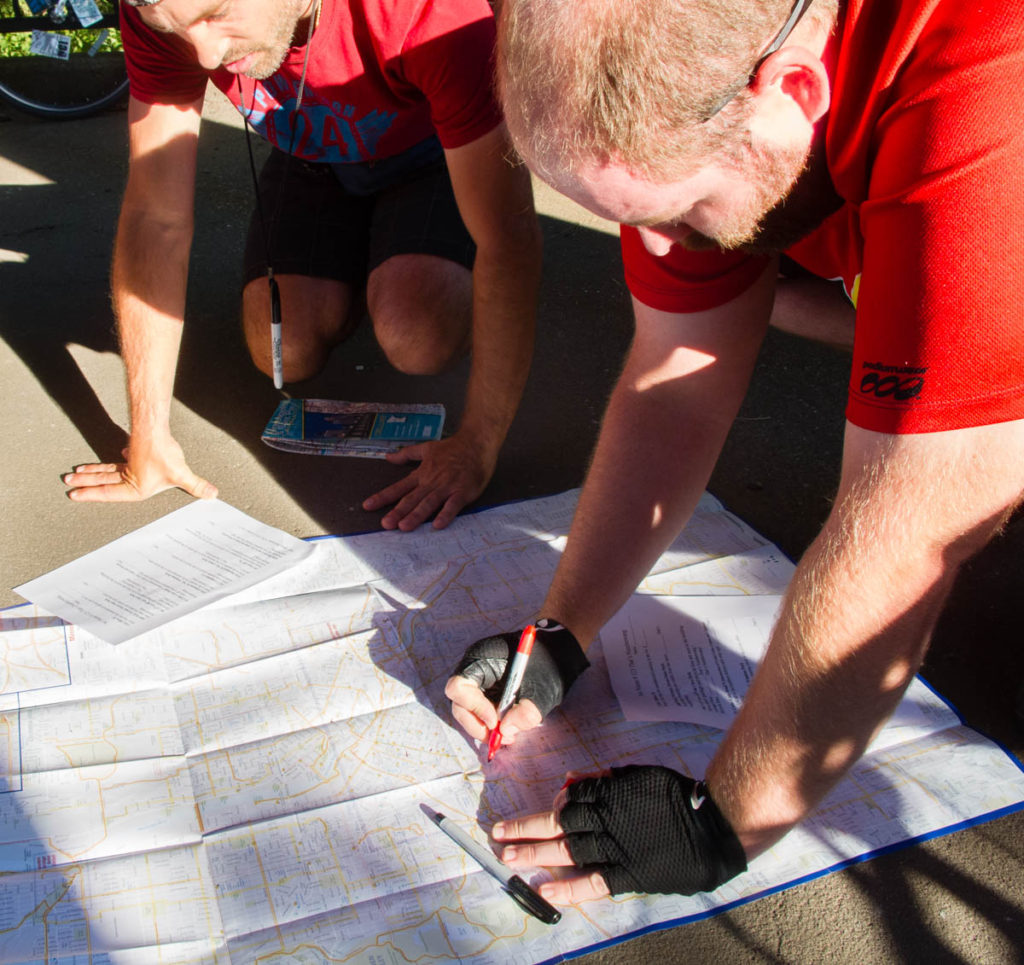
I did a ton of riding in the Twin Cities, largely thanks to my friend Max who provided both a nice bike and a whole lot of guidance on where to go. People who race alleycats know a lot about how to get around the city. I totaled over 300km, and hit almost everywhere I needed to get a sense of Minneapolis and St. Paul.
streets.mn
The Twin Cities have a strong urbanist community, symbolized by the active streets.mn blog. There’s a ton of interesting content there. Several people had suggested that I should meet Bill Lindeke, one of the blog’s regular contributors. Bill describes himself as an urban geographer; in addition to writing on a broad range of subjects for streets.mn and for the Minneapolis Post, and sitting on the planning commission for St. Paul, he organizes walking and biking tours which highlight different aspects of the historical or current city.
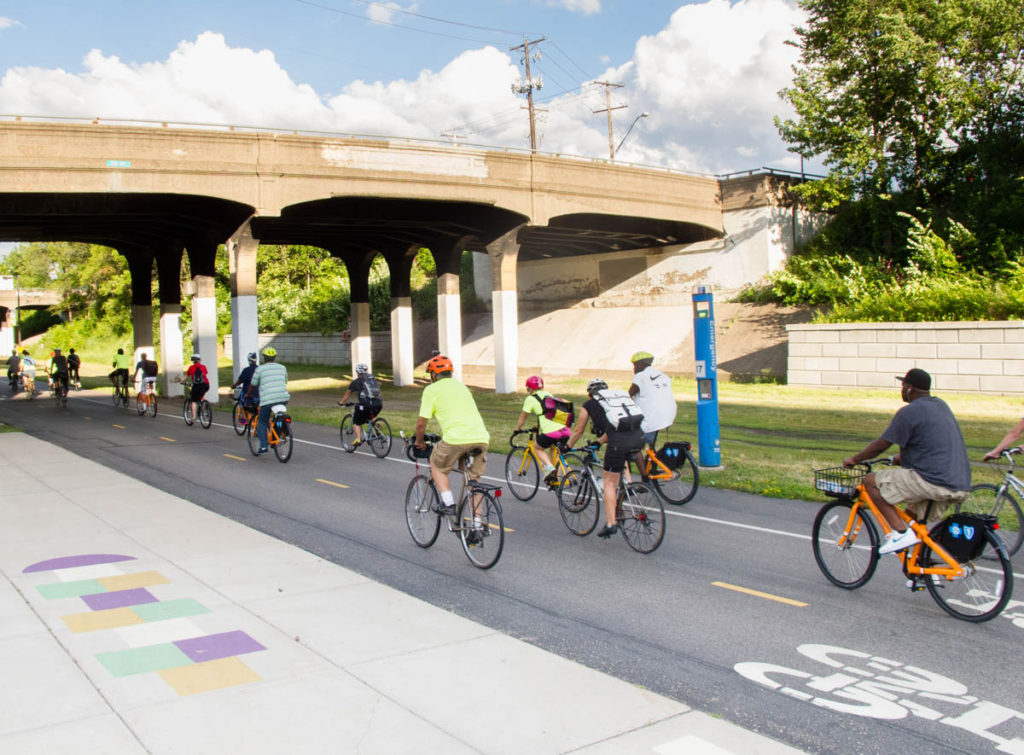
Midtown Greenway
I’ve mentioned the Midtown Greenway a few times, and it’s worth talking about it because it’s really quite an impressive facility. I did a bike count there, and my notes from that day say, “If you want to feel better about the future of the world, go sit on the Midtown Greenway for two hours.” But context matters; its success isn’t easy to duplicate.
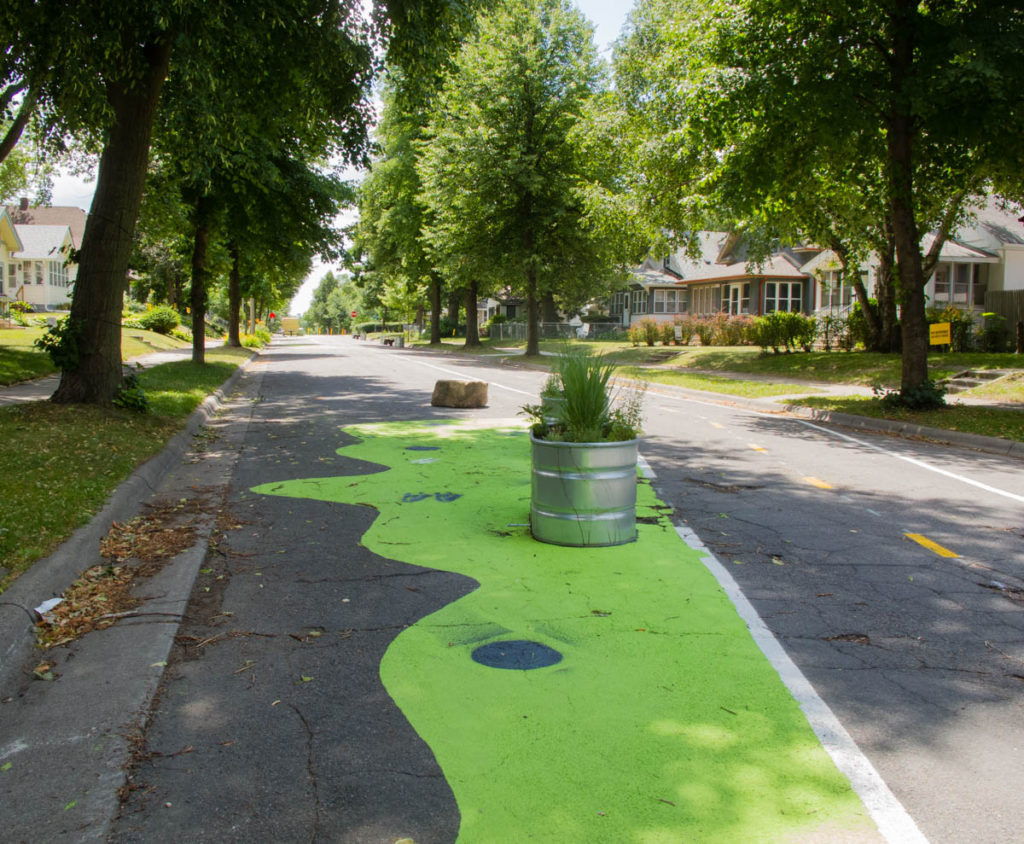
North Minneapolis Greenway
North Minneapolis is a majority-minority district, with African-Americans (43%) being the predominant race. The typical hallmarks of disinvested ethnic districts are found there; decaying infrastructure, fewer trees, poorer schools, and higher crime rates than the rest of the city.
Inspired by the best bike facility in town (the Midtown Greenway, an impressive rails-to-trails conversion of a multi-track trenched railroad), a number of groups have been working for five years to convert some of the low-traffic street infrastructure of North Minneapolis into a greenway.
Unfortunately, skepticism among the neighbors and missteps during the outreach process have made the temporary installation acrimonious and…
Women on Bikes
There has been a fair amount of research done on the “gender gap” in cycling; men bike more then women, though because our data suck we don’t know exactly how much. Different studies show gaps as low as 57-43% or as high as 75-25%. But everyone agrees that women are less likely to bike, and are more likely to be concerned about the safety of the roads they use.
Biking uber-pundit Jennifer Dill (Portland State) did a great study on revealed route preferences of cyclists in Portland that showed significant gender differences in willingness to accept longer travel distances in…
Surly Bikes
I got to meet with John Fleck from Surly Bikes while I was in town. Surly is a Minneapolis bike company that has long been connected with bike messenger culture and urban cycling. Their Long Haul Trucker touring bike and Cross Check cyclocross-inspired bike are extremely popular with utility cyclists, because they’re solid, generally steel-framed bikes which are great platforms for customization.
The marketing materials that Surly puts out still reflect a counter-cultural urban aesthetic, and they’ve had great success contributing to and benefitting from the increase in utility cycling in places like Minneapolis.
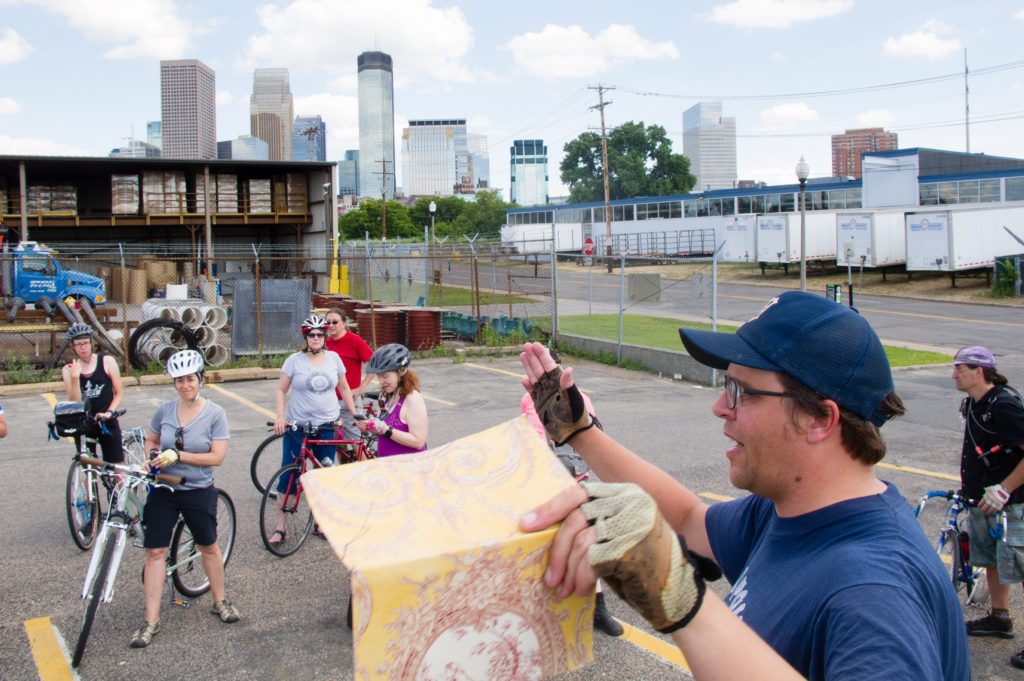
Alleycat races
I am fortunate to have a few Minneapolis friends in the cycling scene. Max has been cycling and tinkering with bikes in the Twin Cities for as long as I’ve known him. He loaned me a sweet Surly Long Haul Trucker for my survey rides, and led me on a number of rides through different areas of the city.
His latest passion has been alleycat races, a race form that grew out of bike messenger culture. Despite the fact that the profession of bike messenging itself has declined precipitously, the culture it spawned continues to effect urban cycling across the…
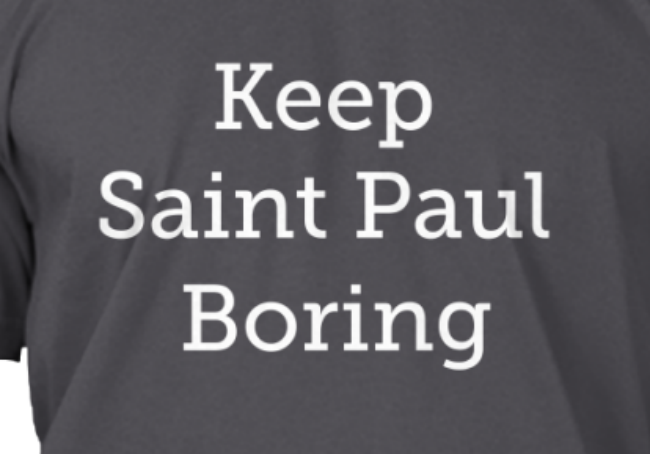
Keep Saint Paul Boring
A cool side effect of having chosen Minneapolis as one of the study cities is that Saint Paul is right next door. Because of the way the two cities were originally founded, and how they’ve grown over the decades, they have very different administrative structures, infrastructure, and politics. Saint Paul is more Garrison Keillor than Sleater-Kinney, and that’s part of why there isn’t as much support for bike facilities and bicycling in the smaller of the Twin Cities.