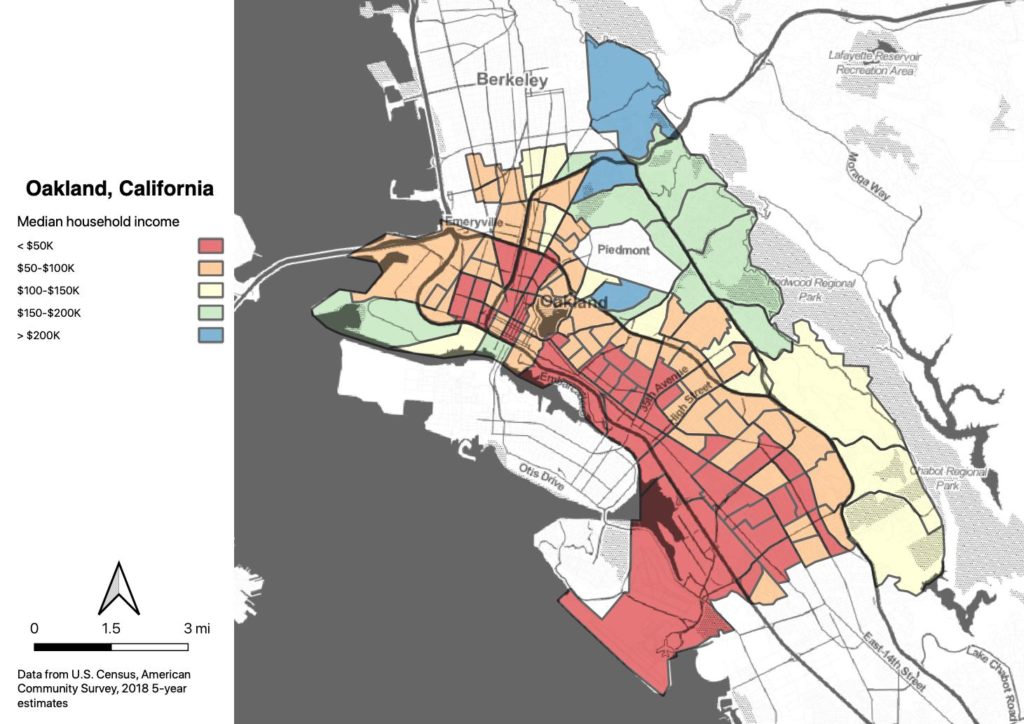
Here are some maps I’m working on, trying to combine OPD police stop data for bikes and pedestrians with demographic info.
It’s not good. In every police beat in Oakland, the majority of pedestrian police stops are of non-whites; in most beats, it’s above 80%. The map doesn’t look quite as bad for bike stops, but that’s because there aren’t very many of them. In beat 13Y, for example (upper Broadway Terrace/Hiller Highlands), there was just one bike stop in the 2016-2017 time frame; same for beats 16X/16Y, Glenview above 580. But in beat 07X (West Oakland/McClymonds) there were 105 stops, 103 of them people of color.


