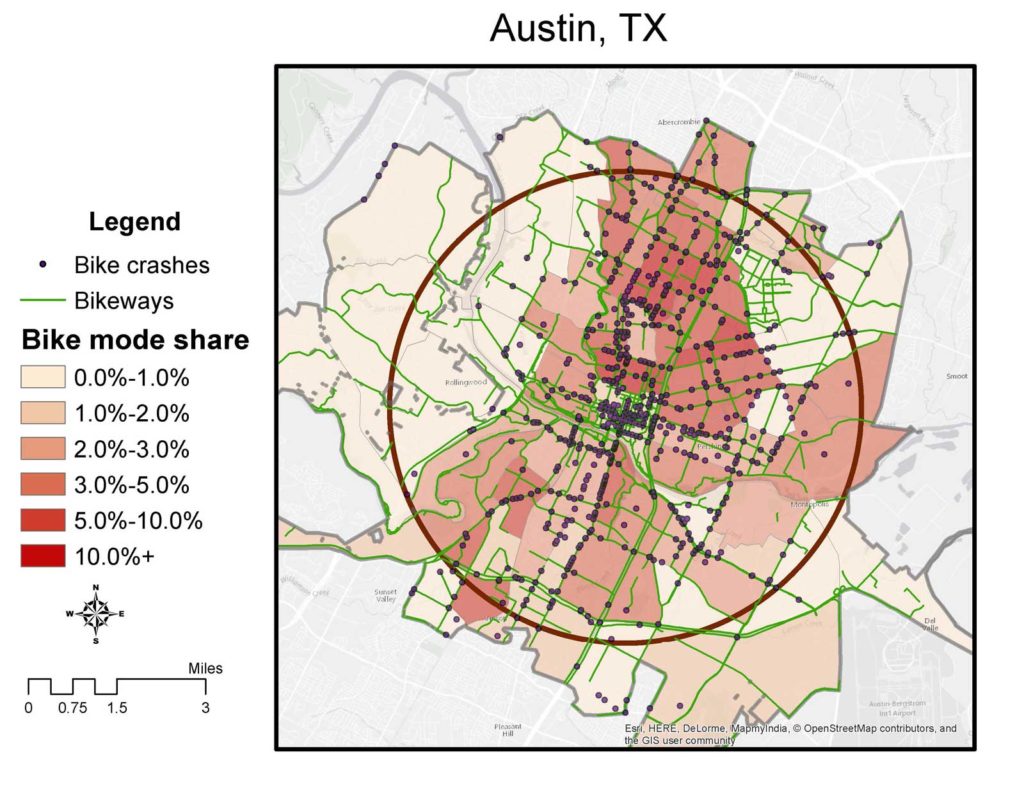
I wanted to get as much data analysis done on my home computer as I could before I head out for study abroad in Berlin. It’s not entirely perfect yet, but I have a workflow which generates these maps right out of Python for all of my cities, with some provision for longitudinal comparisons (limited by data availability). Code has improved enough that on that setup (Mac Pro 2013, 6-core, 12 GB) it takes about a day to generate these for 100 cities.
To do still are to deal with projection issues (they’re all in “web Mercator” because that’s what Leaflet uses), and centering issues caused by inconsistencies between folium, selenium, and PhantomJS. And to improve legends and captions. But it’s pretty cool, if you ask me.
2015
[flickr_set id=”72157683818724493″ max_num_photos=”21″]
2010
[flickr_set id=”72157686472156785″ max_num_photos=”21″]


