Thesis work

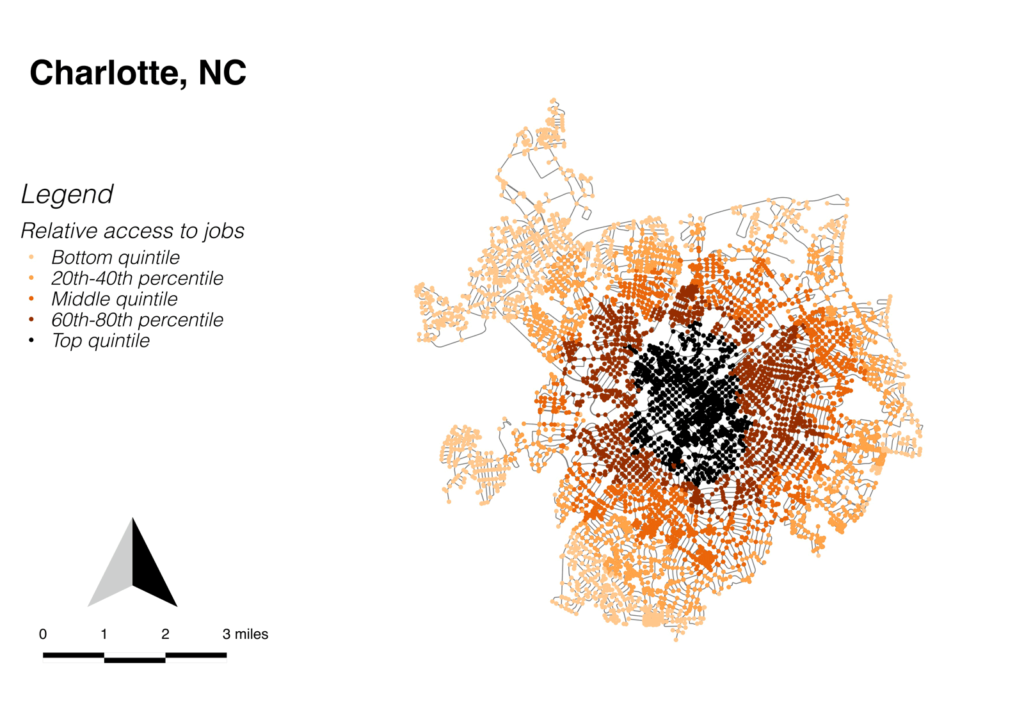
Maps of network connectivity to jobs

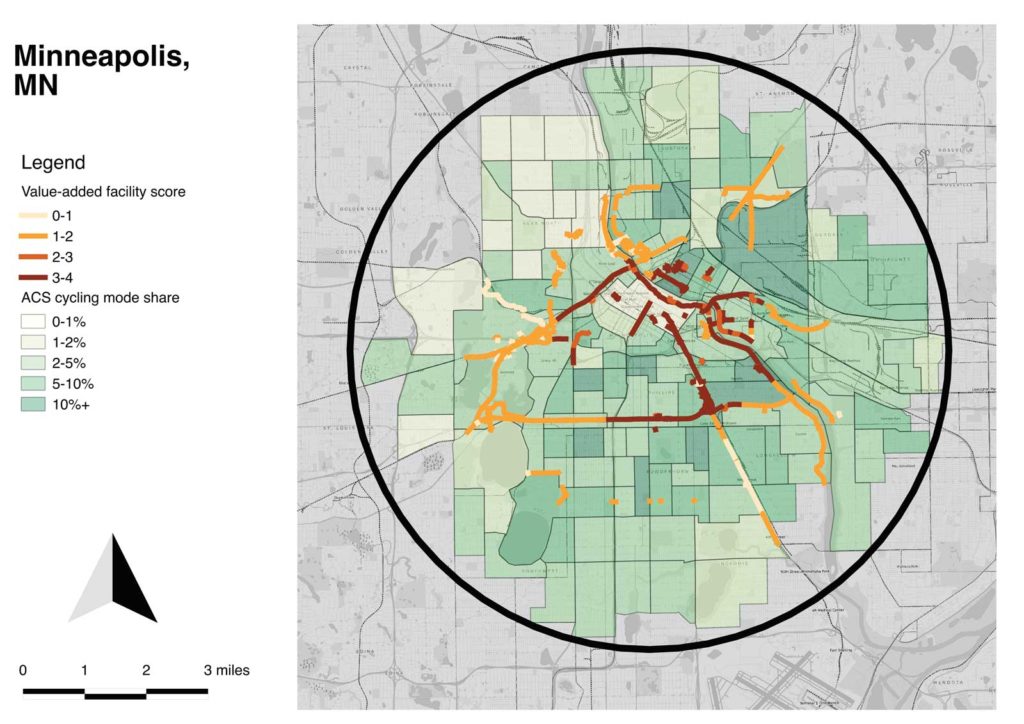
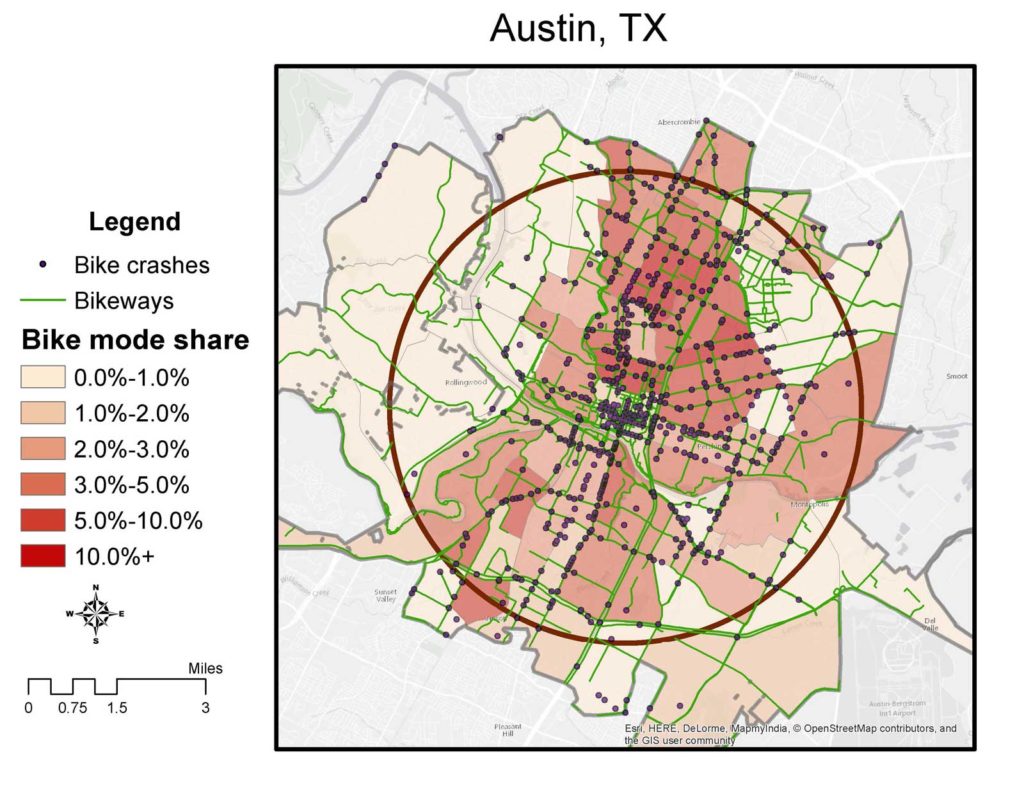
One of the factors I’m trying to measure in valuing facilities is their usefulness; do they actually go where utility cyclists want to ride? One of the factors I used was access to jobs within 1.5 miles along the cycling network. These maps really visualize the differences in density of the street networks.

Maps of commute biking and value-added facilities

Combining my concepts of target area and value-added facilities, I developed maps for each city which select the circle of census tracts near the central city which have the great number of commute cyclists.

One thing that’s visibly notable is the relatively weak connection of value-added facilities to cycling rates; only in Columbus are they well-connected. Part of what I conclude is that cultural factors and the indigenous qualities of the street network are more important than value-added facilities in cycling mode choice.

The methodology is potentially interesting for other kinds of analysis; you could easily optimize for any other census data.

Thesis

I’ve been too busy with thesis work to post any updates here, but now it’s actually done! And I’ll have some time to start sharing bits of it.

The most common reaction I’ve gotten from bike-identified people I’ve shared the work with is, “that’s interesting, I haven’t thought about it that way before,” which I will accept as an indication that the project has been successful.

Bike mode share, facilities, and crashes within 4-mile radius circle in central Austin (1:100,000)

Target area data analysis

One problem I noticed while doing field research is that the city extents vary greatly; Austin, for example, has over six times Minneapolis’ land area, which means that Austin includes some sprawling, low-density areas with low cycling rates that are excluded from Minneapolis’ mode share numbers. I looked at creating a 4-mile radius circle to encompass the highest-cycling area of each city (by ACS mode share data), to be able to develop more comparable metrics from city to city. There are still a lot of issues with the data, but at least I’ll be comparing rotten apples to rotten apples.

Scroll to Top