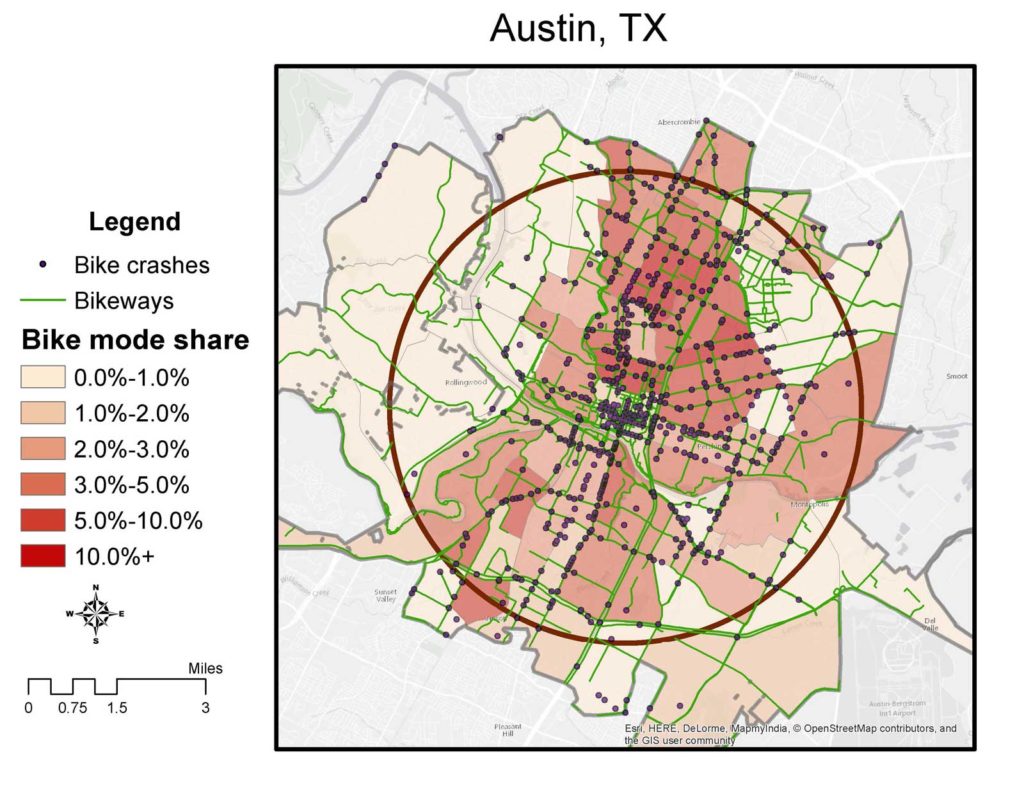
One striking result from the target area analysis is the correlation between residential density and cycling rates in the target area.
| Austin | Charlotte | Columbus | Minneapolis | |
| Target area (mi^2) | 4.86 | 4.11 | 5.11 | 5.25 |
| Population (persons) | 147676 | 71312 | 129290 | 214592 |
| Cyclists (work commute) | 5380 | 464 | 3006 | 10040 |
| Density (persons/mi^2) | 30396 | 17342 | 25311 | 40850 |
| Bicycle mode share | 3.6% | 0.7% | 2.3% | 4.7% |
| Source: ACS 2015 5-year estimates | ||||
Note that the square mileage in the above table is the square mileage of the census tracts fully contained within the target circle. Obviously the circles themselves have the same area, but because of differences in tract shapes, and non-land areas (lakes and rivers) within the circles, the census tract areas differ. This table reflects only the census tract areas, because it’s using census data.
For these four data points, the correlation between density and bicycle mode share is dramatic (r=0.97), which seems to speak to the importance of indigenous conditions in people’s mode choices. And there’s probably a real effect there. Unfortunately, the effect disappears when examined at the census tract level, becoming slightly negative in all four cities. My hypothesis is that there are threshold effects, where the most dense census tracts actually have less cycling because their walk mode share is higher. I didn’t have time to dig into that question, but it would be consistent with some of the work done by urban design superstar Jan Gehl.
Two things I would like to do are to automate the analysis to the point where I could examine this same question across many more cities, and, to combine the city data to see if the correlation flips back to the positive side when looking at census tracts across the four cities. I expect that both of those methods will show a strong positive correlation between density and bicycle mode share, but not near r=0.97.