I’m going to be throwing a lot of data out there in this series, so I wanted to start with a few caveats about my process, and about data analysis in general.
Accurately describing the social dynamics of the city through data analysis is a persistent challenge, and the geospatial dynamics aren’t much easier to get at. A simple-sounding question like, “how has the proportion of Blacks in this neighborhood changed over time?” runs into all kinds of problems with the definition of terms and the availability of data.
Geographic boundaries
The idea of a “neighborhood” is a social one; there are no strictly defined boundaries, and the labels and de facto boundaries change over time. Census tracts are strictly defined, but they also change over time, especially in areas undergoing significant population growth. Street grids are generally the most enduring feature of the city, but names of streets change all the time.
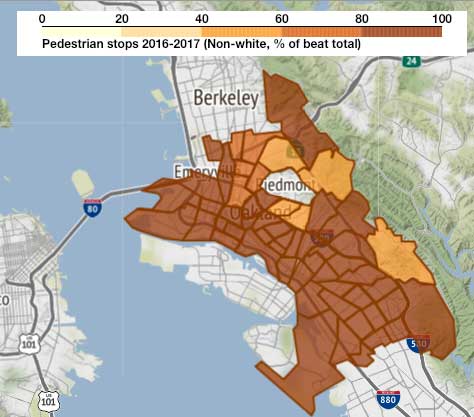
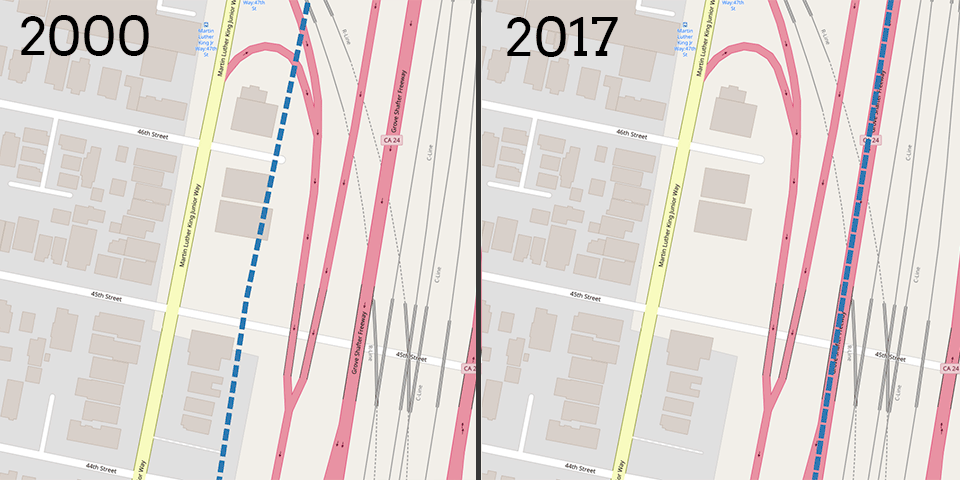
For the purposes of this project, I am looking at streets which are named “Martin Luther King”, as of today, as defined in OpenStreetMap. (OSM does have historical street data but only dating back to 2013). I’m intersecting the location of those streets with census tracts, as defined in the 2017 American Community Survey (ACS), and the 2000 decennial Census. There are some places where the method doesn’t produce reasonable results; San Francisco, for example, where Martin Luther King Jr. Drive is in Golden Gate Park, and for some reason the census tract includes only the park, where there are virtually no permanent residents. But in most places the results look reasonable, with one additional caveat: Because of the history of redlining and segregation, “MLK Way” in many cities represents a boundary between neighborhoods, and is often used as a Census tract boundary. So, small differences in the tract boundaries (such as whether the boundary is drawn on one side of the street or the other) can result in the inclusion or exclusion of a boundary neighborhood, which could skew some results. And the boundary definitions available for the 2000 Census are less detailed than those for the current ACS.
Demographic changes and terminology
When discussing demographic changes, it’s important to distinguish between percentage, percentage point, and population changes. For example, Columbus, OH’s Martin Luther King, Jr. Boulevard is a short street not far from where I stayed in Olde Towne East when I did field work there. The census tract which contains MLK Boulevard was 63% Black in the 2000 Census and is now 45% Black. That’s a drop of 18 percentage points. But the actual Black population of the neighborhood has risen since 2000; according to the 2017 ACS, 2926 Blacks now live there, up from 2464, which we could talk about as a percentage increase of 18.7%.
It may seem paradoxical that the population can drop by 18% and rise by 18% at the same time, but between 2000 and 2017, the White population of the census tract rose from 1086 to 2575, a percentage increase of 137%. The White population increased by 12 percentage points and now constitutes 28% of the neighborhood population. (Increases in Asian, Hispanic, and multi-race individuals account for the rest of the difference).
It’s important to get the terminology right, because these numbers connect to the story of the neighborhood we’re trying to understand. How and why is the neighborhood changing, and who is benefiting or being disadvantaged by the change? A neighborhood that is losing its Black population but not growing overall has a different story than a neighborhood that is growing but retaining its Black population, and the policy implications are different.
I’ll break down some of those differences as I work through this series, and I’ll try to be clear on my terminology while I do it.