I try to avoid the term “gentrification.” The word gets used to signify so many different things–neighborhood cultural change, displacement, and reinvestment, for example, which are not at all similar–that the term has become meaningless. But, since part of the founding premise of the Bike Lab was to look at the relationship of bike infrastructure to gentrification, I have to grapple with the concept.
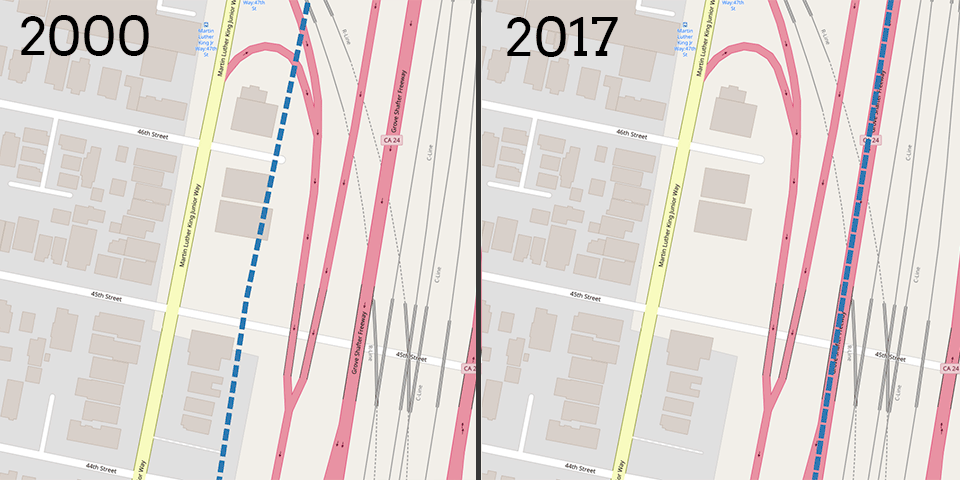
As I’ve ridden around doing field work, I’ve noticed that many cities have a Way, or a Boulevard, or a Drive, or a Parkway, named for Martin Luther King, Jr., and that those streets are often located in neighborhoods which were predominantly African-American in the 70s and 80s when the dedications were made. In Oakland, our Martin Luther King Way was formerly named Grove Street, and it’s a very interesting road. It’s where the Black Panther Party was founded and had its first headquarters. As more or less the boundary of the red-lined districts of North Oakland, it became a boundary between white and black, and between affluent and poor neighborhoods due to segregation and disinvestment. Not coincidentally, it also became the alignment for the elevated BART tracks which further divided the neighborhood. (And on the Berkeley side of the city limits, it became Ground Zero for neighborhood activism, led by Mabel Howard, which resulted in the tracks being put underground).
In today’s Oakland, Martin Luther King, Jr. Way travels through one of the city’s most rapidly gentrifying areas. (There’s that term again.) And the same seems to be true in other cities I have visited. And it so happens that I’ve built a data analysis platform to compare spatial and Census data across cities. So I’ve been meaning to do a project looking at the neighborhoods of Martin Luther King Ways for some time, and MLK Day this year prompted me to actually put some work into it.
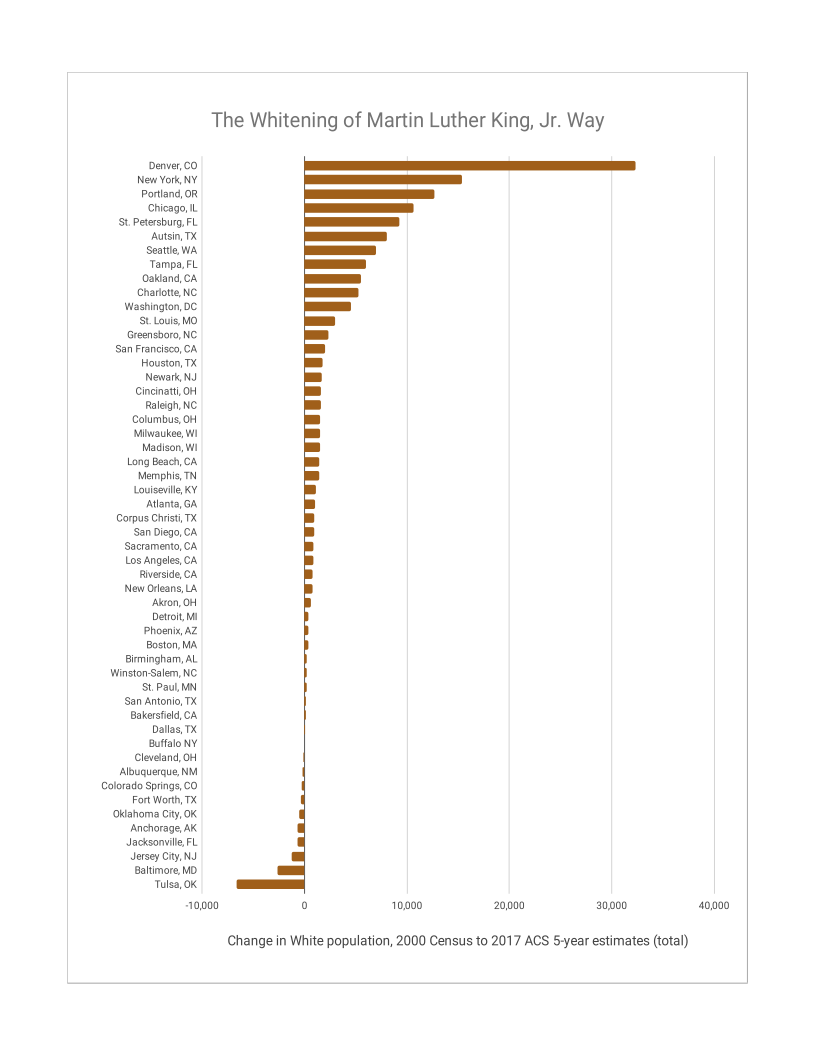
I started with a list of the top 100 U.S. cities by population, and used Geoff Boeing’s OSMNX package to search OpenStreetMap for streets named “Martin Luther King”. (52 of those 100 cities have such streets). I then looked at which census tracts intersected those streets, and pulled data for those tracts from the decennial 2000 census, and from the 2017 ACS 5-year estimates (so, centered on 2015). This gave me the ability to analyze what demographic characteristics have changed in a 15-year period in predominantly African-American neighborhoods in those cities.
Like gentrification itself, the answer is complex. I generated a lot of rich data to analyze, so this post will be the first of several digging into it. But here’s a teaser.
These census tracts have assuredly become whiter in the past 15 years: across the 52 cities, the White population rose in 42, totaling over 130K individuals. But, that’s far from the whole story, which will be unfolding as I look into the changes in these places.