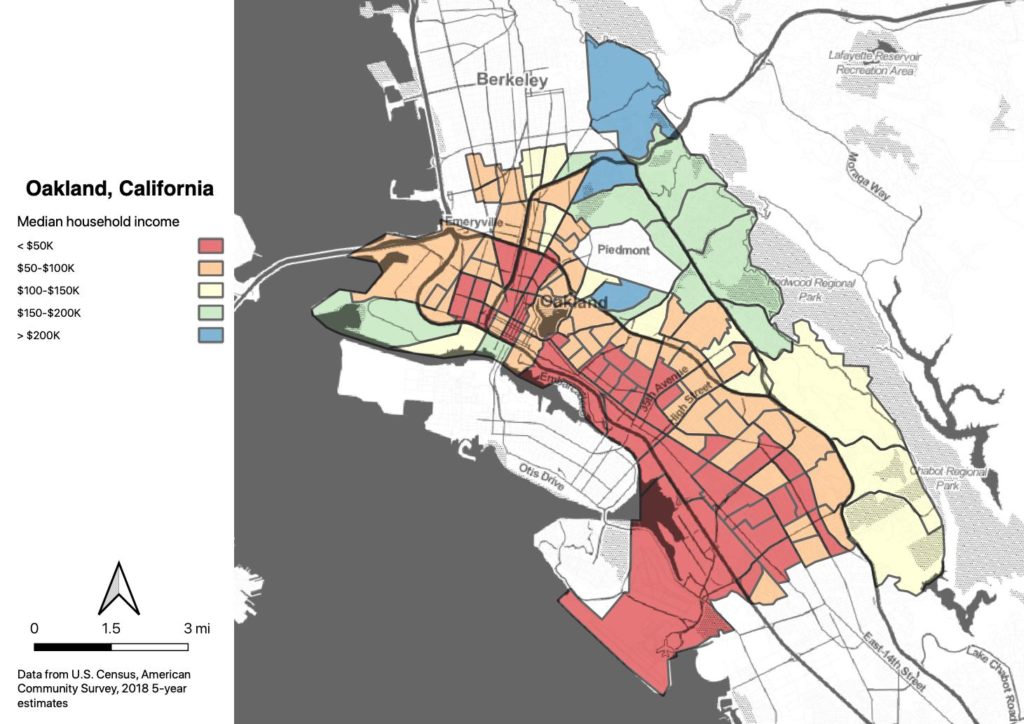
The Black Panther Party got its start on Oakland’s Martin Luther King, Jr. Way (then named Grove Street). After the racial profiling traffic stop and confrontation with police which led to the founding of the party, Huey Newton and Bobby Seale established the first party headquarters in a storefront near to Merritt College where they were studying at the time. (Now the It’s All Good bakery: worth a stop to see their display of Panther memorabilia, and get a slice of 7-Up pound cake). It was partly fear of the Panthers which led the city to make Grove/MLK the boundary where the elevated BART tracks and the 980/24 freeway would be routed.
Anyone living there today can tell you that the neighborhood is one of the most rapidly gentrifying areas of Oakland, which is why it shows up in the group of cities where MLK Way is undergoing displacement: a decrease in Black population and an increase in population overall, coupled with an increase in median income and other markers of socioeconomic change. This is the most common case in the data set, with 15 cities meeting the criteria (counting Brooklyn and Manhattan separately).
| Total population change, 2000-2017 | Population change, Black, 2000-2017 | Real median income change (2018 $), 2000-2017 | |
|---|---|---|---|
| Anchorage, AK | 4,996 | -535 | -$1,472.08 |
| Austin, TX | 7,759 | -3,051 | $5,702.92 |
| Brooklyn, NY | 782 | -1,498 | $4,024.70 |
| Chicago, IL | 798 | -18,730 | $4,088.67 |
| Columbus, OH | 938 | -1,454 | $18,254.93 |
| Corpus Christi, TX | 452 | -570 | $10,014.22 |
| Denver, CO | 26,910 | -7,070 | $41,425.66 |
| Fort Worth, TX | 5,574 | -1,950 | $1,337.75 |
| Houston, TX | 6,374 | -3,104 | $3,621.28 |
| Los Angeles, CA | 3,628 | -9,906 | $2,208.32 |
| Madison, WI | 1,353 | -334 | $20,667.02 |
| Manhattan, NY | 287 | -1,218 | $14,232.39 |
| New Orleans, LA | -5,071 | -7,019 | $4,542.03 |
| New York, NY (all boroughs) | 7,575 | -751 | $5,544.82 |
| Oakland, CA | 4,395 | -4,673 | $18,165.84 |
| Portland, OR | 7,049 | -5,549 | $16,315.86 |
| San Francisco, CA | 337 | -95 | $22,753.61 |
I had to dig into the Denver numbers more closely, because they’re pretty crazy. The area has increased in population by over 50% since Y2K, and the White population has increased from 7,974 to 40,293 in that time (405% increase). At the same time, the Black population has dropped from 21,021 to 13,951 (34% decline), while the real median income has nearly doubled. Black people now constitute less than 20% of the population of this area of the city.
Because there are so few Black people left, I mapped it by median income:
I wanted to look into that zone in the east where everyone’s rich (median income > $125K). It turned up a glitch in the data, which is that the 2000 decennial Census does not report median income for that tract. What’s up with that?
Turns out, this is how it looked in 2000 (thank you Google Earth):
These are the abandoned airfields of the Stapleton International Airport, which was replaced by DIA in 1995. Between 2000 and 2017 the area was completely redeveloped, apparently into fancy neighborhoods. So the figures may be a bit off but this is probably the most radically changed census tract in the study, and all the change is in the direction of redevelopment for the affluent.
After Denver, Oakland and Columbus, OH top the list in terms of the pace of change. Jerry Brown was elected as mayor of Oakland in 1999, championing what he called the “10K Plan”; a vision to revitalize Oakland by bringing 10,000 new residents to downtown. Brown explicitly wanted those residents to be affluent (“Market-rate units are needed to bolster the tax base”, the Oakland Tribune quoted him as saying in 1999), and it must be said that his plan succeeded at its goals. Oakland has more residents, higher median income, and a lot more vitality than it did before Brown’s tenure. But the 10K Plan included no equity or social justice goals, and the changes to MLK Way reflect one of its outcomes; displacement of poor Black residents by more affluent Whites. Anecdotally, the process seems to be accelerating in the Longfellow neighborhood where the Panthers got their start; the Urban Displacement Project lists that area (the two northernmost tracts, below) as experiencing “Ongoing Gentrification and/or Displacement.”
From the perspective of economic development, Jerry Brown’s vision has been a success. Real median income has risen by over 50%, which is a huge gain. But from the perspective of community economic development, the vision failed; the economy has been developed, but the community has been displaced. Over 25% of the total Black population has left these neighborhoods, replaced primarily by Whites and Hispanics. Many of the individuals and families who used to live near MLK Way have been forced to move somewhere else to make way for more affluent residents.
This style of gentrification—spurring economic development by replacing low-income renters with more affluent homeowners—is in many cities the only extant economic development strategy. To be fair, Oakland has become more interested in engaging with the challenge of community and economic development than it was under Brown. I’d say today it’s probably one of the leaders in the U.S. in terms of being aware of the problem. But with Bay Area incomes rising so rapidly, and with Silicon Valley work/jobs imbalance so severe, there is a lot of pressure on housing, especially in places near where the tech shuttle buses run. (Many stop at MacArthur BART, near the center of the map).
It is difficult to track where the former residents of MLK Way went. We can speculate that some moved to the Bay Area exurbs, which are gaining Black population (see Alex Schafran, “The Road to Resegregation: Northern California and the Failure of Politics”), and some may have moved to Southern cities like Atlanta or Memphis which are regaining Black residents.
But the really difficult problem is to figure out how to benefit the community without displacing it.


