On the eve of the Super Bowl, CityLab posted an article about a neighborhood in Atlanta which was destroyed to build the Georgia Dome, which itself was later destroyed to build Mercedes-Benz Stadium, where the game was played. It so happens that Atlanta’s Martin Luther King, Jr. Drive runs right by the stadium. It being Black History Month, I thought I should dig into the history of the place.
Street grids are the most enduring feature of cities. Spatial practice (land use) can change relatively quickly. Buildings can be demolished and re-built in a different style or at a different scale. But It takes a major disruption to change the street grid; there are street grids laid out over 2,500 years ago in North Africa, Europe, and Asia which still define portions of their cities today.
Here are three maps of northwestern Atlanta, overlaid with today’s MLK Drive census tracts. Even in the 1864 map, the street grid of what would later be called the Lightning neighborhood is present.
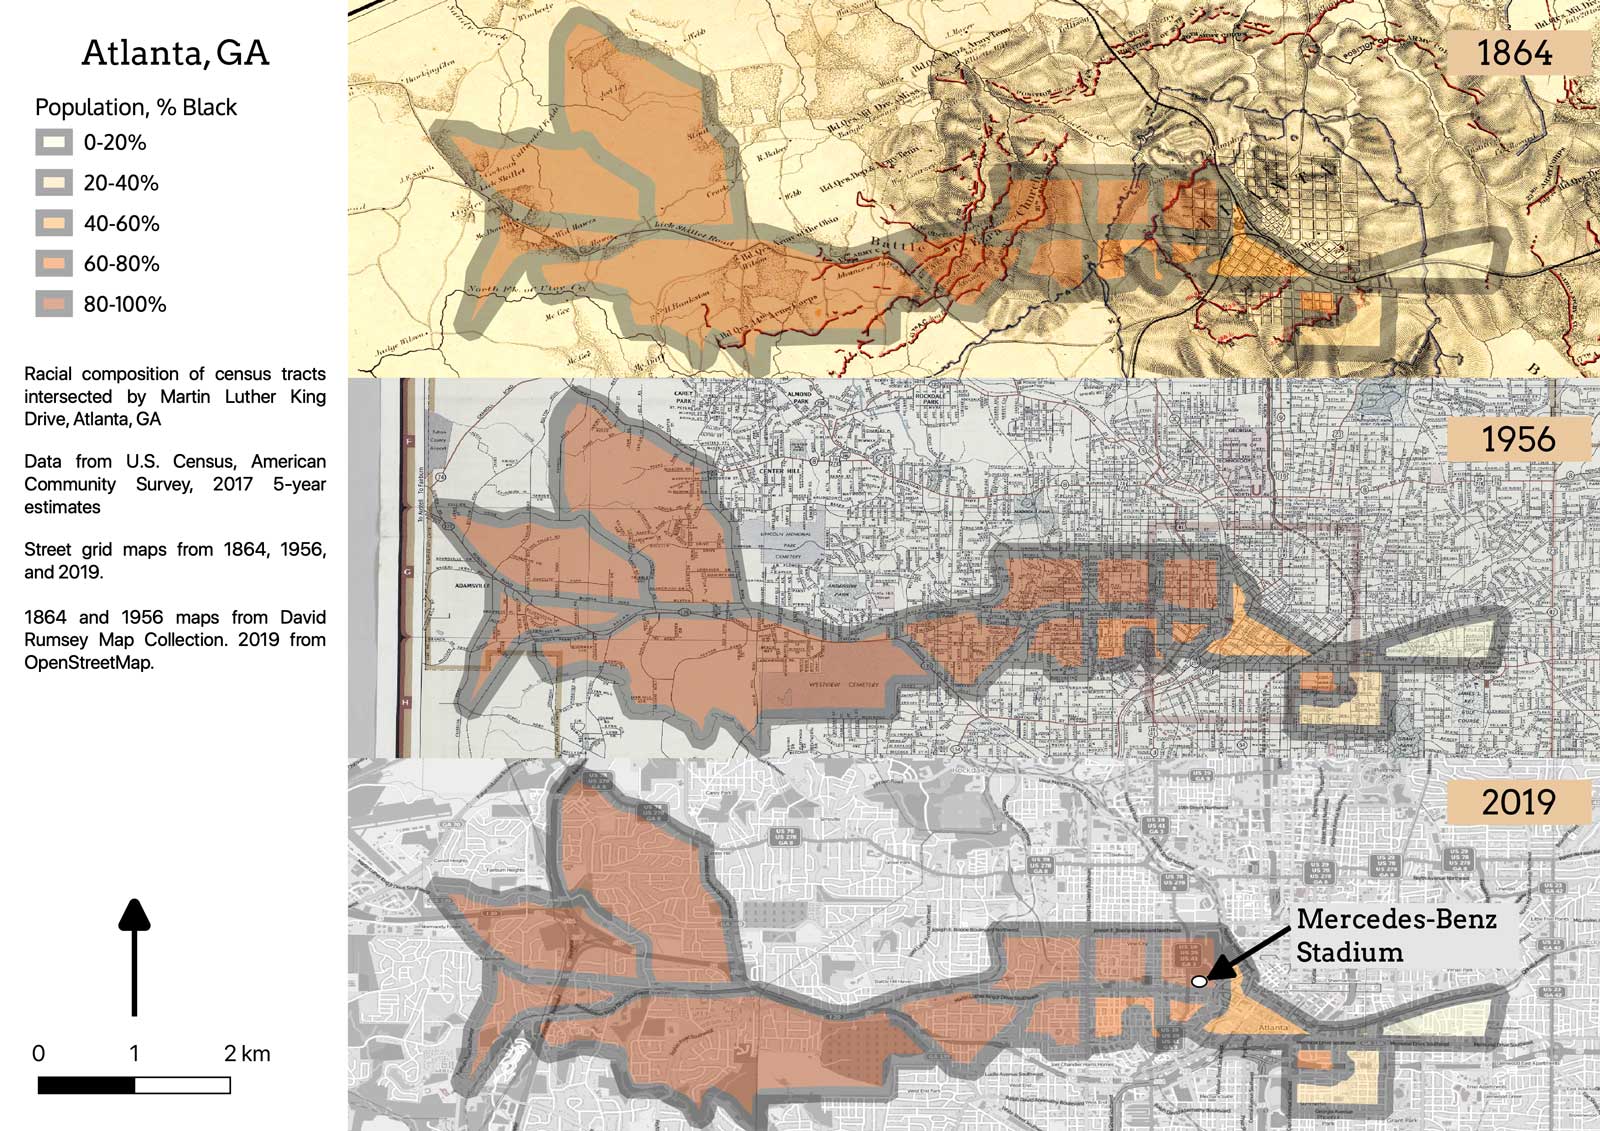
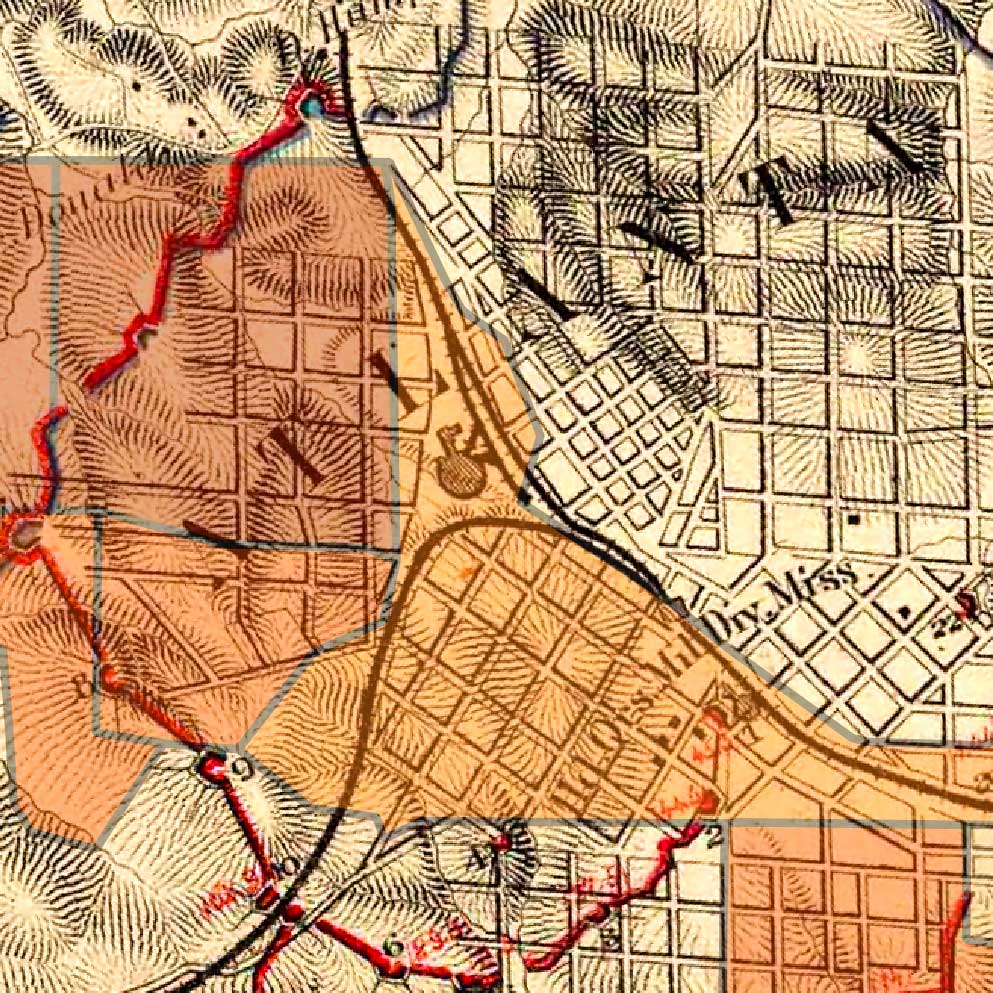
The Civil War map details the 1864 Siege of Atlanta. The streets in question at the time were at the northwest edge of the city; the Confederate army position (red lines) was just outside the neighborhood. Today’s MLK Drive heads out into the modern suburbs, more or less or less following what in 1864 was called Lick Skillet Road; the Battle of Lick Skillet was part of the assault on Atlanta.
Forward almost 100 years, in 1956 the neighborhood was a seamless part of the city. Note the border on three sides of this map detail; this neighborhood was important enough to be part of the inset map of Atlanta. But this entire area was redlined in the HOLC maps of 1938, which meant that banks would not fund home loans here. HOLC made its redlining decisions based on race; if black people lived in the neighborhood, it was viewed as risky to loan there.
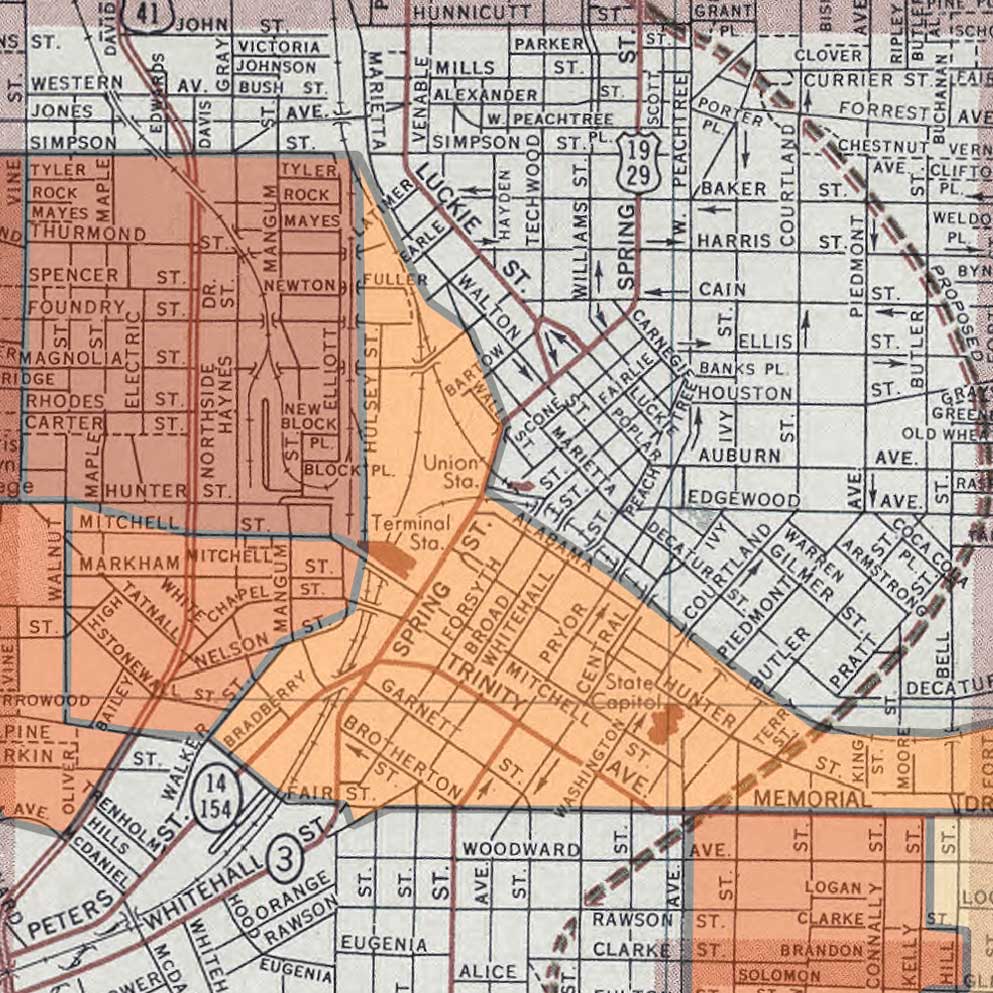
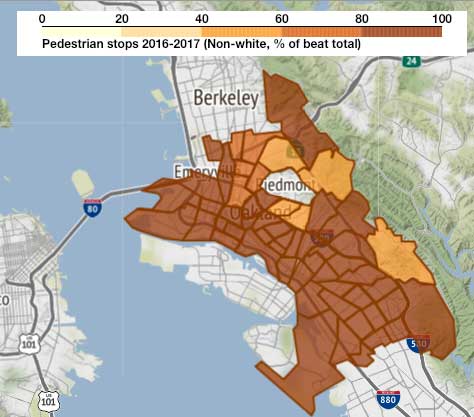
If you’ve paid any attention to the history of U.S. city planning, you will not be surprised to learn that when the city was looking for a location for a football stadium, the neighborhood chosen for destruction was predominantly African-American. In 1990, the census tract which now contains the stadium and its parking lots was over 98% Black.
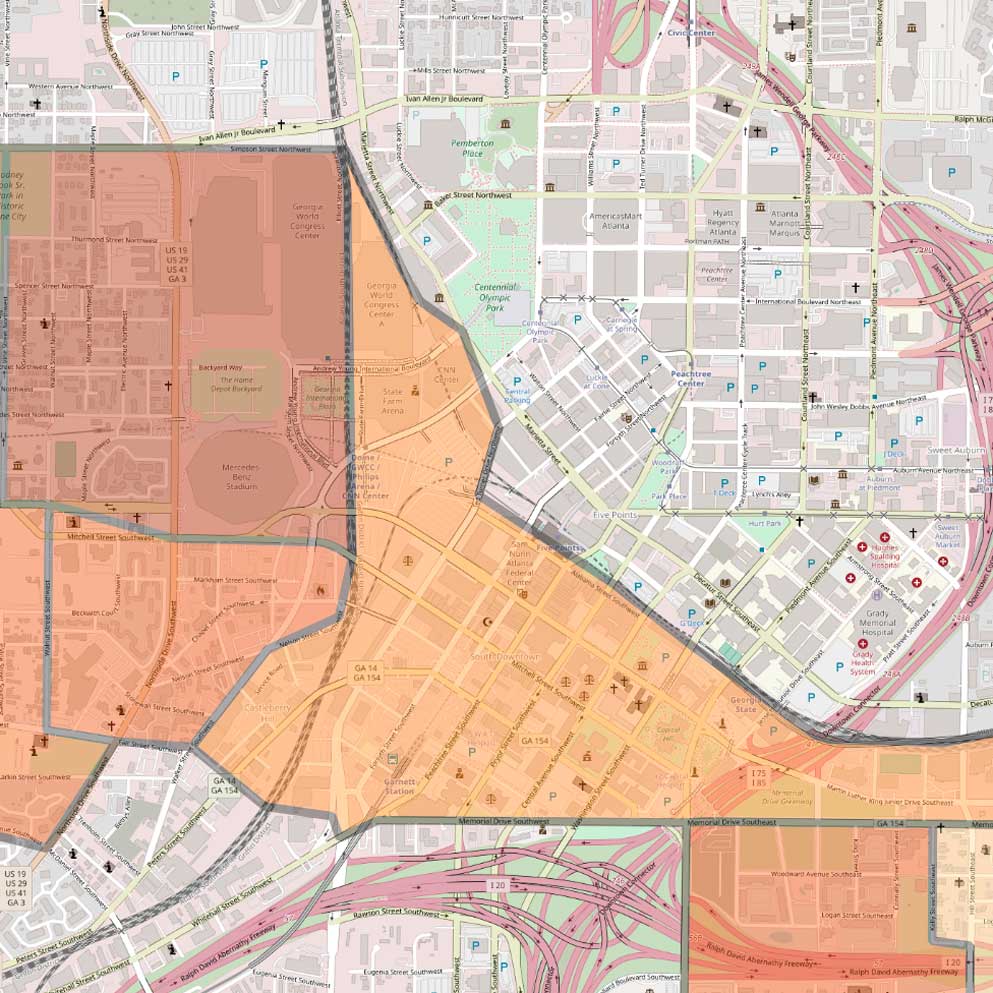
Because MLK Drive in Atlanta is so lengthy, connecting the central city to the sprawling suburb, it highlights a national trend among affluent cities; what Urban Habitat calls resegregation. As we reinvest in the inner city, poorer individuals and families are being displaced to less-expensive suburbs and exurbs. The great wealth disparity between white and Black people in America (whites hold more wealth per capita by a factor of at least 10), caused in part by redlining and related housing practices begun during the Depression, continuing through the 2007 housing crisis and to today, results in Black people being less able to participate in the housing market (or any other market, for that matter). So when we allow the market forces to play out, they result in Black people leaving the now-desirable areas and re-concentrating in less-desirable areas. In Atlanta, that’s west of the stadium. Every census tract west of the stadium is over 80% Black; one is over 97% Black.
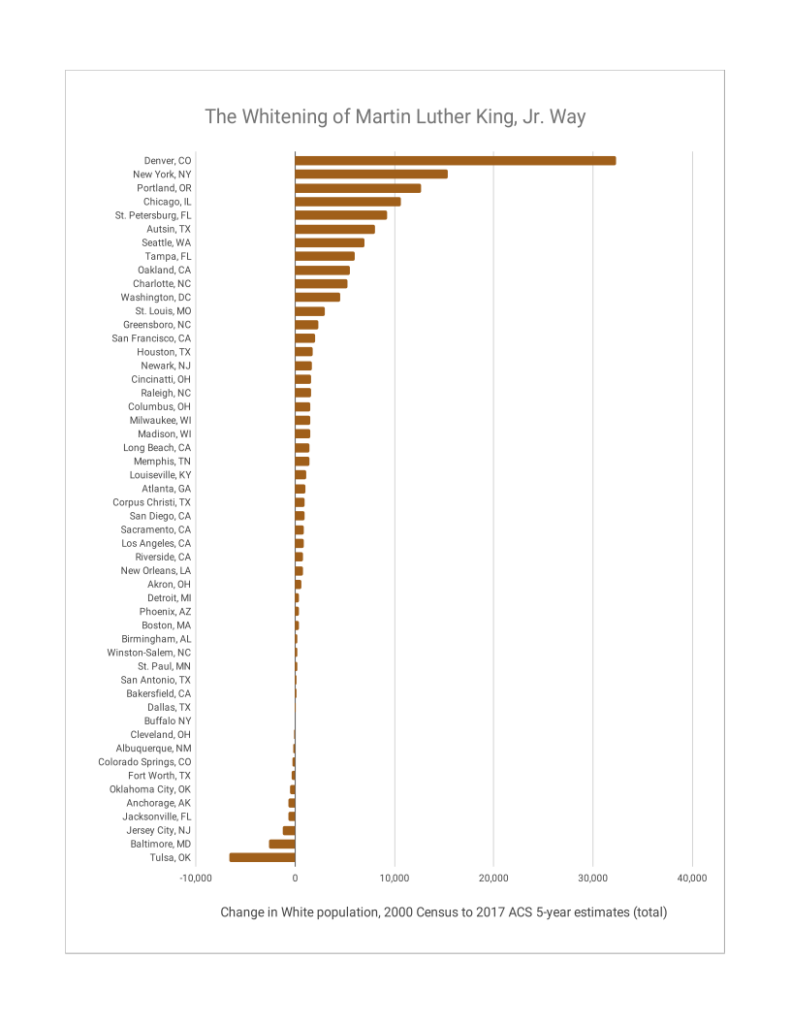
Here are the nine cities where MLK Way is gaining Black population and losing income. A couple are glitchy data (El Paso and St. Paul).
| Total population change, 2000-2017 | Population change, Black, 2000-2017 | Real median income change (2018 $), 2000-2017 | |
|---|---|---|---|
| Cincinatti, OH | 3979 | 662 | -$2,241 |
| Colorado Springs, CO | 599 | 223 | -$9,929 |
| El Paso, TX | 15,509 | 1,599 | -$5,859 |
| Greensboro, NC | 4203 | 464 | -$1,434 |
| Jersey City, NJ | 6,933 | 304 | -$7,116 |
| Riverside, CA | 6,266 | 243 | -$7,611 |
| Staten Island, NY | 6,506 | 1,965 | -$3,652 |
| St. Paul, MN | 1,709 | 1,021 | -$23,336 |
| Tampa, FL | 2,344 | 317 | -$3,401 |
| Toledo, OH | -2,652 | 205 | -$13,003 |
One of my hypotheses for this study was that this particular pattern would be prevalent in Southern states. Georgia gained over 800,000 Black people between 2000 and 2017, and other Gulf Coast states saw similar increases. But the data don’t really support the hypothesis; Greensboro and Tampa fit, but the rest of this sample is scattered around the country.
Wherever those new Georgia Black people are moving to, it’s not to Martin Luther King, Jr. Drive in Atlanta. Dr. King himself was born in Atlanta, of course; he grew up on the east side of the city in a different, also redlined neighborhood.
The inclusion of Staten Island here is notable. Staten Island was settled in colonial times, but most of its development was after WWII as a White suburb, really an exurb, almost as far away from Manhattan as the New Jersey town where I grew up. Like most post-war suburbs, it developed primarily as segregated, low-density single-family housing, at one point being over 80% White, the only NYC borough with a White majority. It is also the only NYC borough which voted for Donald Trump in the 2016 election (56%-40%). But today, the area around Doctor Martin Luther King Jr. Expressway, near the Bayonne Bridge, is gaining Black population, which is declining near the MLK Boulevards in Manhattan and Brooklyn. Housing is significantly cheaper on Staten Island; comparable units are 5-10 times more expensive in Harlem and Brooklyn. Those with limited wealth are moving to places where land is cheaper.
We no longer have federal policies enforcing segregation. But we do have federal, state and local policies which assume that markets are the best way to implement policy objectives. Markets always advantage those with resources over those without; used as a policy tool they tend to reinforce disparities.