At NPC19 I saw Jesus M. Barajas (formerly at SafeTREC, now faculty at UIUC) speak about his research on racially-biased policing of bikes and pedestrians in Chicago. One of the questions I had for him was, has anyone figured out how to improve the situation? What policy interventions could reduce the problem of Biking (or Walking, or BBQing) while Black in America?
His answer wasn’t encouraging, but he did suggest that Allwyn Brown in Richmond (CA) had done a lot of work to change the culture of RPD. And since I’m going up to Rich City Rides tomorrow, I thought I’d see if I could run some numbers there.
One problem with this kind of analysis is that there’s no standard for what data gets collected or shared. The data I used for my analysis of Oakland’s policing includes police beat and race, and since 2016, whether the stop is of a bike or pededstrian, but lacks specific location or any incident ID. Richmond’s public data has an incident ID, but doesn’t separate bike stops from ped stops, and the stop data set does not include race. They do have a separate data set on “Detentions”—stops which resulted in a search or other action—and the Detentions data set does include racial data. The Detentions data set is much smaller, so the graphs don’t work as well. Richmond’s city extent is also a little tricky, because there are unincorporated areas in the middle of the city which are officially patrolled by the county sheriff but also see RPD policing. I decided to select all the census tracts in the areas around Richmond for this analysis.
Because the data sources are so different, caution must be exercised in directly comparing Richmond and Oakland’s numbers.
That being said: It’s not great. Here’s the graph on Black stop bias in Richmond census tracts.

Richmond’s Black population is a lower proportion than Oakland’s (17%), and while the percentage of detention stops is slightly lower than Oakland’s (63%), it still shows up as a strong bias against Blacks, everywhere in the city.
Looking only at stops resulting in arrests, the bias isn’t quite as strong (59% city-wide).
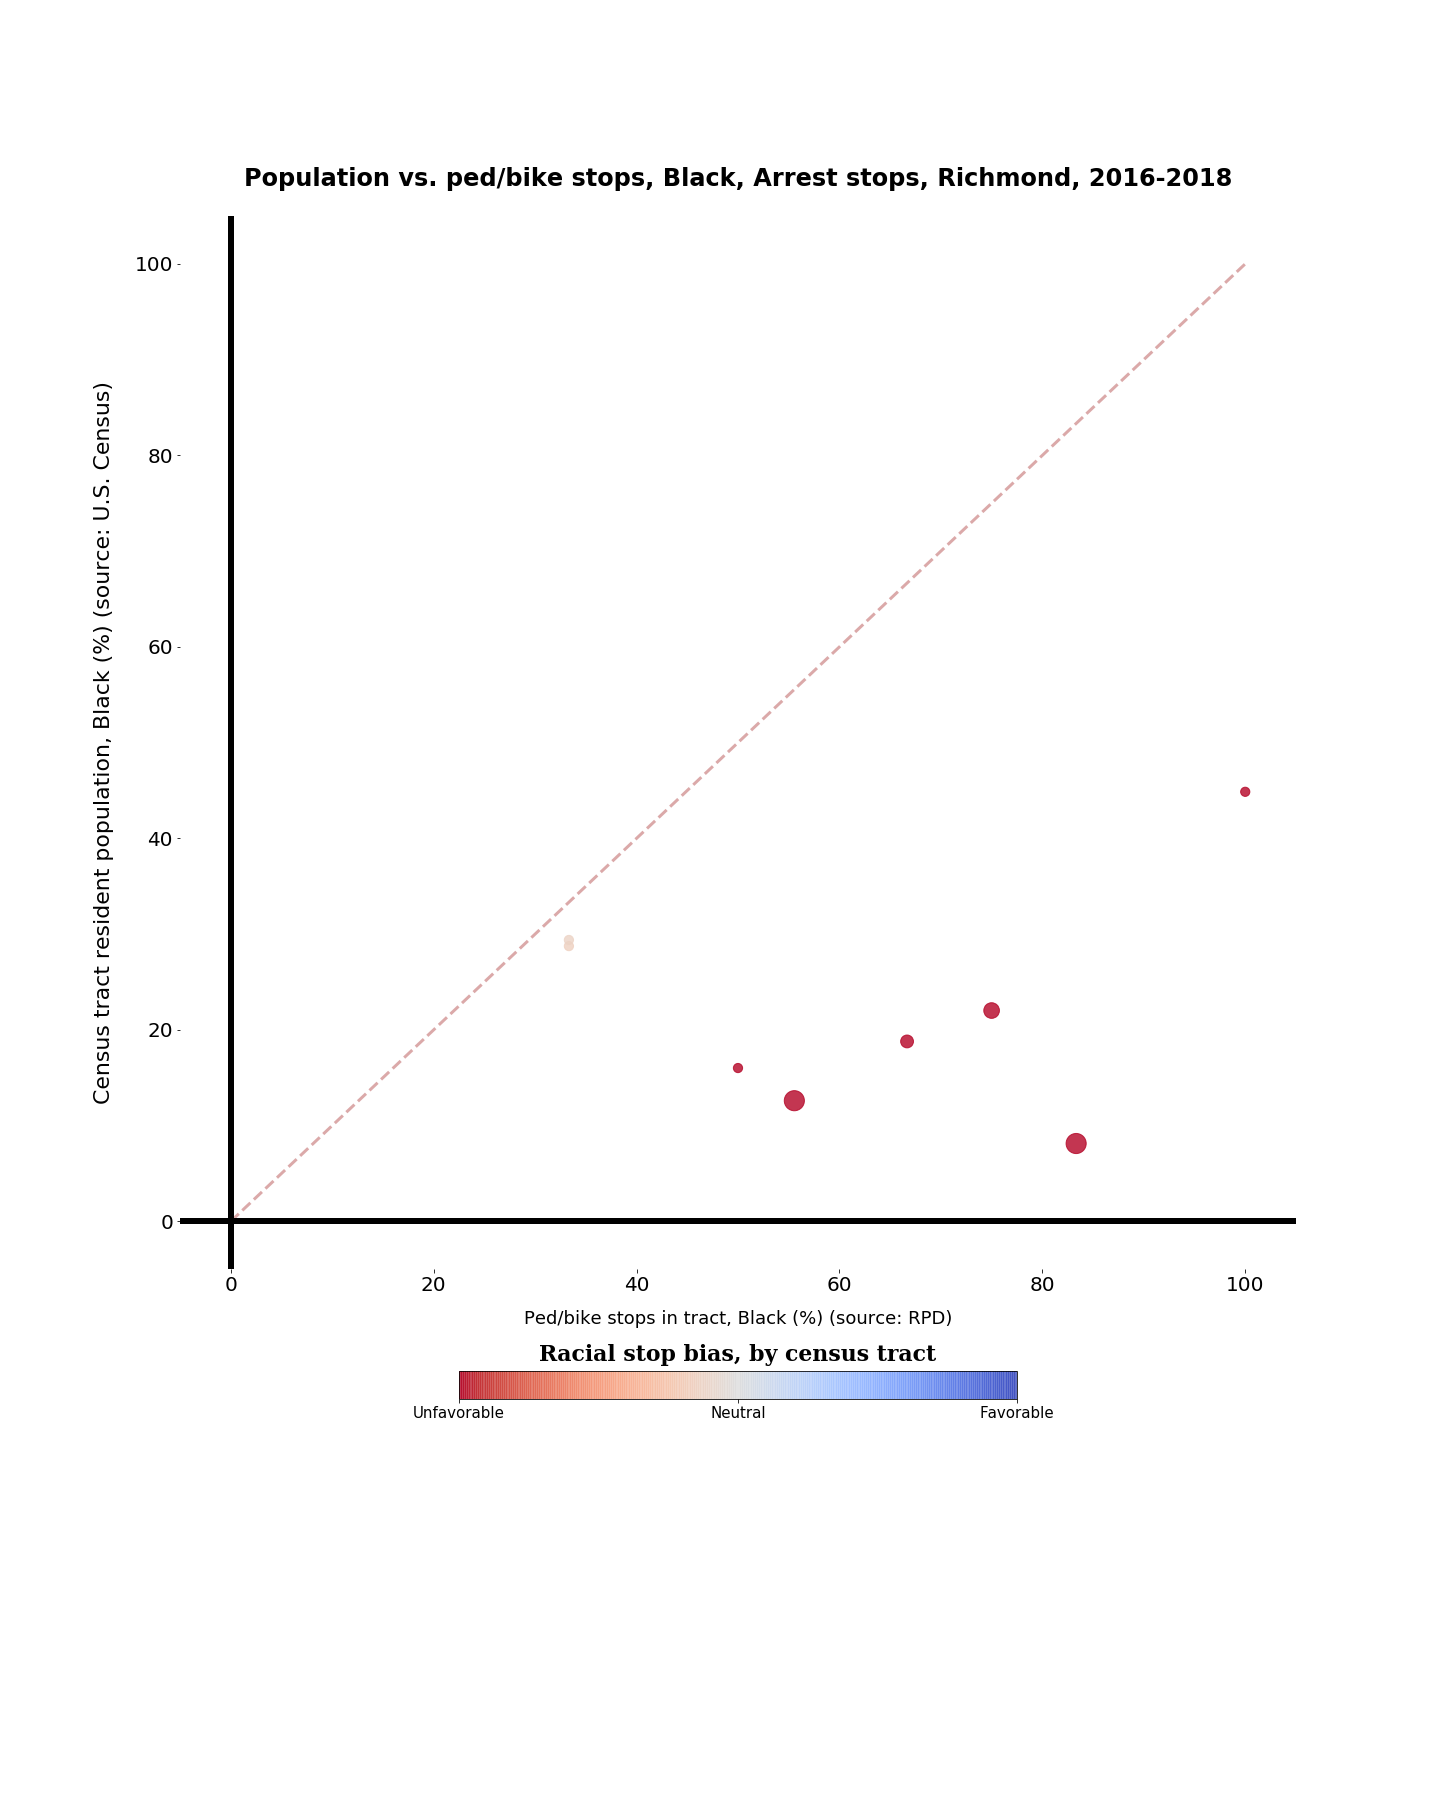
Here we’re getting into very small sample sizes: there are only 32 arrest stops in the data set, and 19 of them are of Blacks. (Zero are of Asians). So the difference between 63% and 59% is probably in the noise.
I checked whether things were better in 2018 (the available data set runs from August 2016 to November 2018), and the answer is, not really; in 2018 there were 63 Black stops out of 105 (60%), still within the statistical noise. So looking only at detentions, any reforms enacted by RPD do not appear to have made a substantial difference yet.
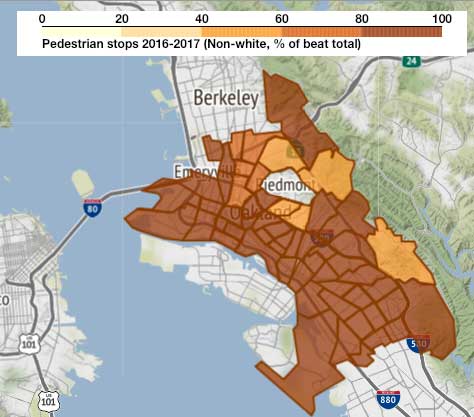
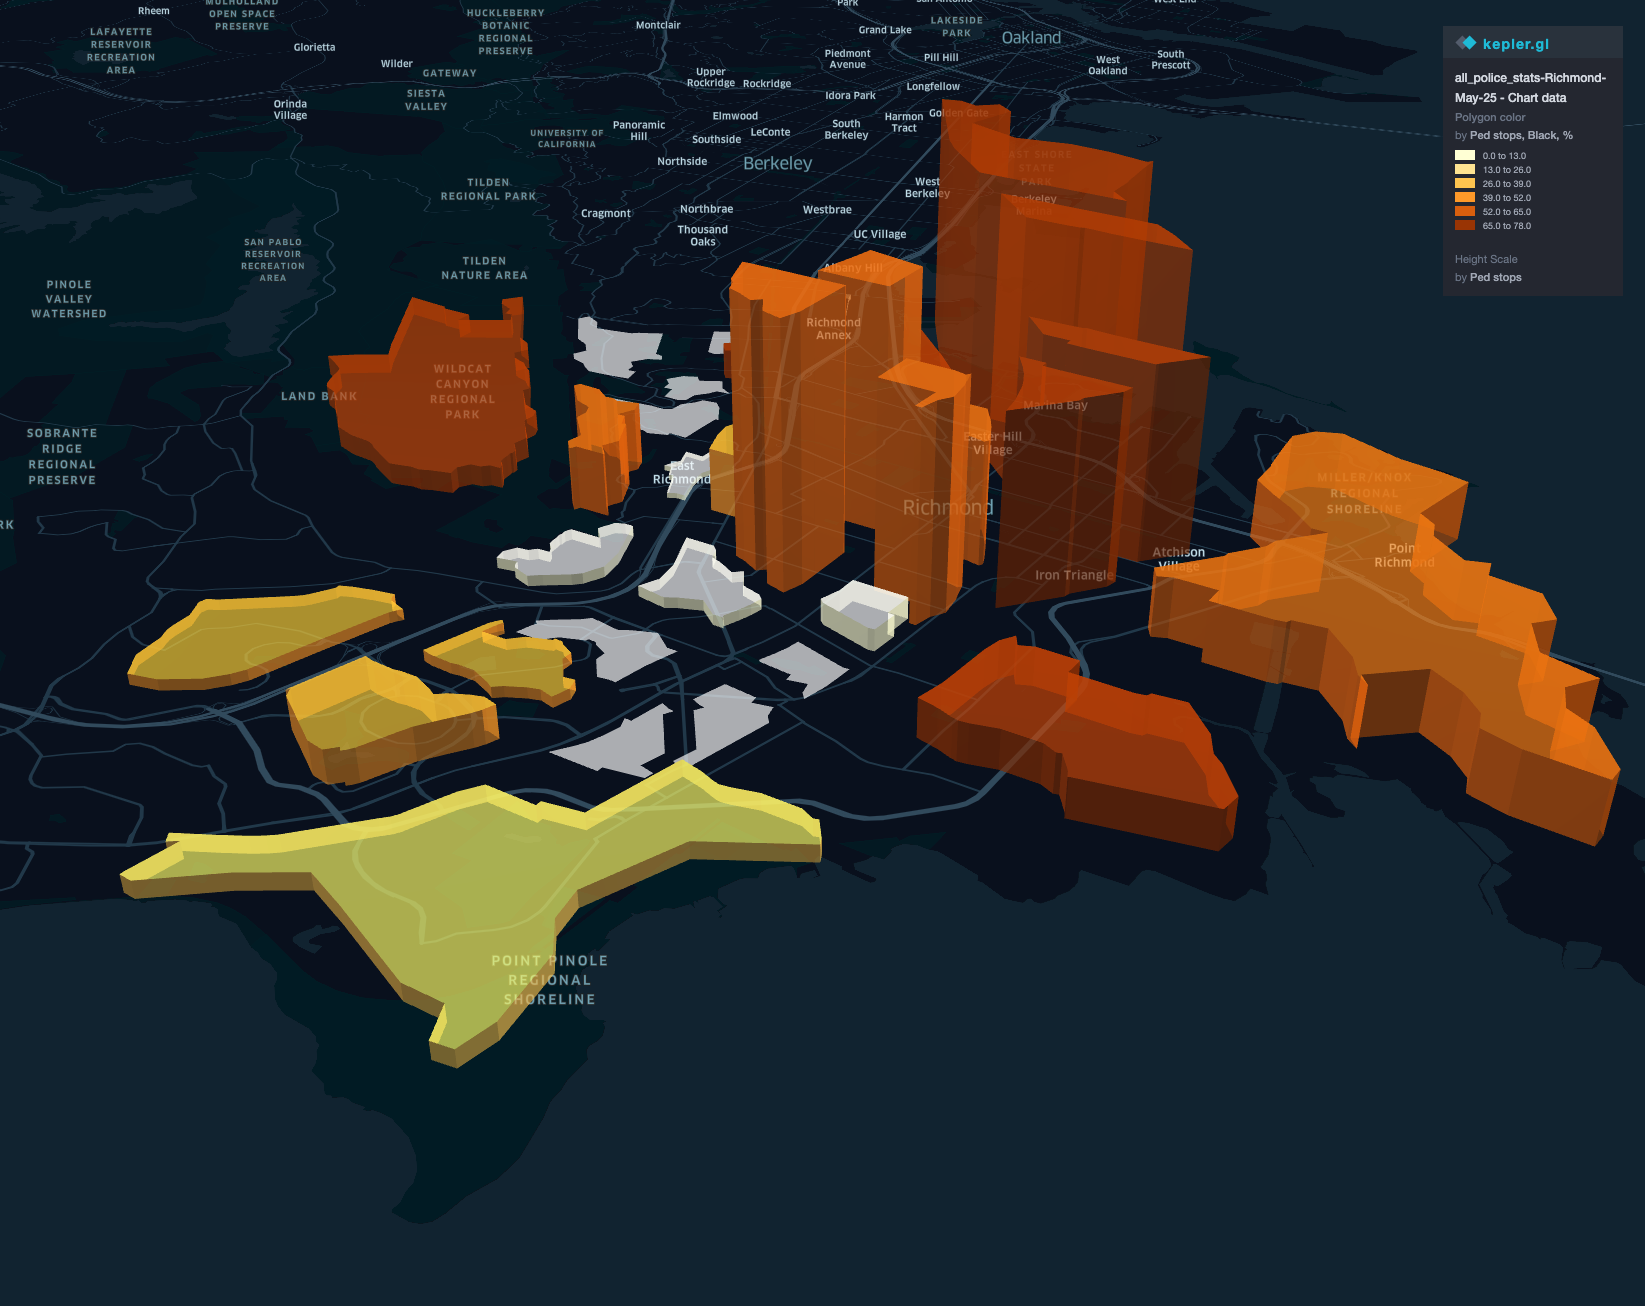
As in Oakland, the stops are spatially biased. This graph is a bit misleading because it includes only RPD stops, while some of the tracts are patrolled by other agencies. But the broad pattern probably holds.
References
U.S. Census Bureau (2017) American Community Survey 5-year estimates. Retrieved from https://api.census.gov