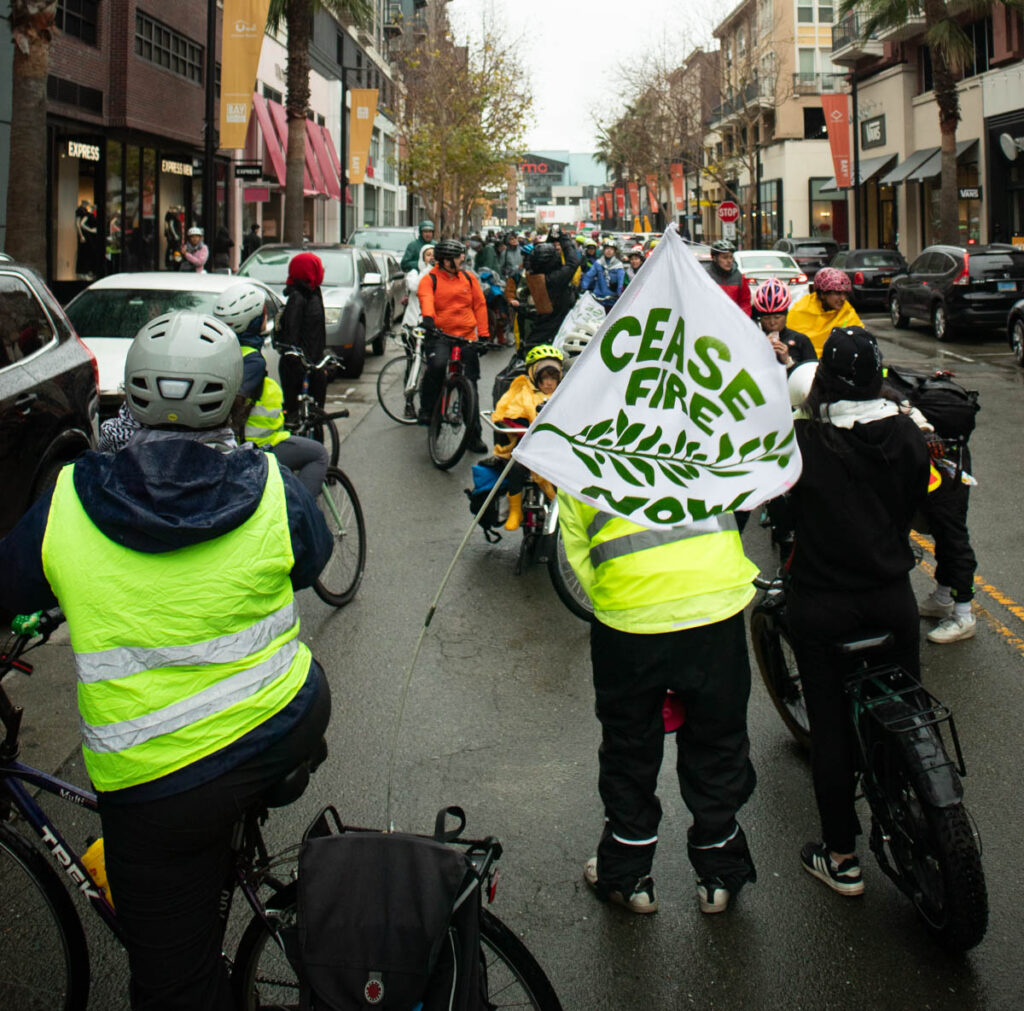
Posts by tom

East Oakland and resilience

On Tuesday I did my Tour of Oakland bike ride, and one of the impressions I came away with is that East Oakland, especially Deep East, has been less affected by the shelter-in-place order than the rest of the city. Much of the economy of East Oakland is informal, so shutting down the formal economy doesn't hit the neighborhood as hard. I saw a few of the Scraper Bike Team kids out, too.

Displacement and density

After doing some crunching this week on data about rapidly-gentrifying Valencia Street in San Francisco, and finding that residential density is actually dropping in the neighborhood despite new housing construction, I wondered whether the same phenomenon could be found elsewhere in the country. I didn't have to wait long for another case study, as Lynda Lopez and a number of other peeps I follow from Chicago posted about Mayor Lori Lightfoot's ill-considered statement about "vibrancy" in Pilsen, a gentrifying neighborhood west of the Loop. It turns out that the demographic dynamics in Pilsen are very similar to Valencia Street, and they challenge the claim that infill development is a climate solution.

Two maps of Valencia Street in San Francisco, showing a large increase in median household income from 2000-2018, and a sizable decrease in Hispanic population.

Bike infrastructure and displacement

I have been really, really trying to avoid getting into the housing debate. But transportation and housing are inextricably linked, and my investigation of bike infrastructure's relationship to gentrification is part of the Bike Lab's work. A Twitter thread sparked by Phil Matier's terrible SF Chronicle article led me to do some data analysis of Valencia Street's transformation. Some of the results are pretty staggering.

Map of San Francisco showing Golden Gate Park and a selected census tract (67000) in the Outer Sunset

Error bar

Phil Matier is a terrible journalist. One of the ways in which he's terrible is that he doesn't understand statistics at all, or at least, the way he uses statistics in his writing is uninformed (at best) or intentionally misleading (at worst). I'll be charitable and assume that the fallacies in his work come from a place of ignorance rather than deception.

The Douchebag Problem

As an urban critical theorist studying cycling cultures and neighborhood change, I've long been curious about the correlation between the terms "fixie" and "douchebag." My working definition is that douchiness is where entitlement meets cluelessness. The douchebag is a privileged person who feels entitled to that spot at the bar, that condo in the city, that job in tech, and that private bus to work which makes it all possible. And he is clueless about how his entitlement to those things pushes others out of the way.

Top down

I've been thinking about how cycling and skateboarding cultures are different, and I have the impression skating has never embraced top-down hierarchy in the same way bike advocacy has. Reading Peter Flax's interview with Effective Cycling founder John Forester, I realized that Forester is just as concerned with being at the top of the hierarchy as traditional bike advocates; he just disagrees about how to get there.

3-D map of Oakland police beats with colors showing percentage of Black stops of bikes and pedestrians in each beat, with height showing the number of stops in the beat. Highest bars are in Fruitvale, most black in West and East Oakland

Racially-biased policing in Oakland (updated with 2018 data)

Rachel Swan (SF Chronicle) recently published a story about police bias in Oakland, including newly-available data from 2018. Overall, OPD stopped a lot fewer people in 2018, but even after accounting for that, the number of Blacks stopped dropped more than other groups. Eberhardt suggests that the reduction in stops represents a move towards "intelligence-led" policing. I don't see how the data supports her assertion. In 2018, 31% of all the stops are listed as "IntelligenceLed", while in 2016-2017 that number was 29%; a small change, certainly not enough to account for a 30%+ drop in the total number of stops. Looked at on a beat-by-beat basis, you can see that the reduction in stops was broad across the city, but the biggest drops came from West and Deep East Oakland.

Richmond Bridge bike path opening

The big event this weekend was the opening of the Richmond Bridge bike path. Najari killed it with his remarks at the ribbon-cutting, and I enjoyed the path more than I expected to. A lot of that was the energy of the event, where there were at least 1,000 cyclists. The few times where I was riding more or less solo, the isolation and noise of the bridge felt a bit oppressive; I think on an average day noise and smell will be real issues. But it's better than another car lane.

Chart showing fatal crashes in Vision Zero cities from 2011-2018, gradually rising about 20%.

Revisiting a bad idea

My posts earlier this year suggesting that Vision Zero's communications strategy of amplifying safety risks might be counter-productive received a little bit of attention. I wanted to revisit the analysis to include the 2018 data from both the ACS and FARS, and to address some methodological criticisms.

Community-rooted partnerships

Aidil Ortiz, the lead organizer of Untokening Durham, came into city planning work from a background in public health, and he perspective reflects that somewhat unusual path. In addition to doing great work organizing the event, she gave probably my favorite talk of the conference, about her work on community engagement for the Durham Belt Line, a rails-to-trails greenway project on the outskirts of downtown. Her session was fantastic, and also relevant to Oakland's bike plan (and, I hope, others).

1 2 3 4 13