Data

Two maps of Valencia Street in San Francisco, showing a large increase in median household income from 2000-2018, and a sizable decrease in Hispanic population.

Bike infrastructure and displacement

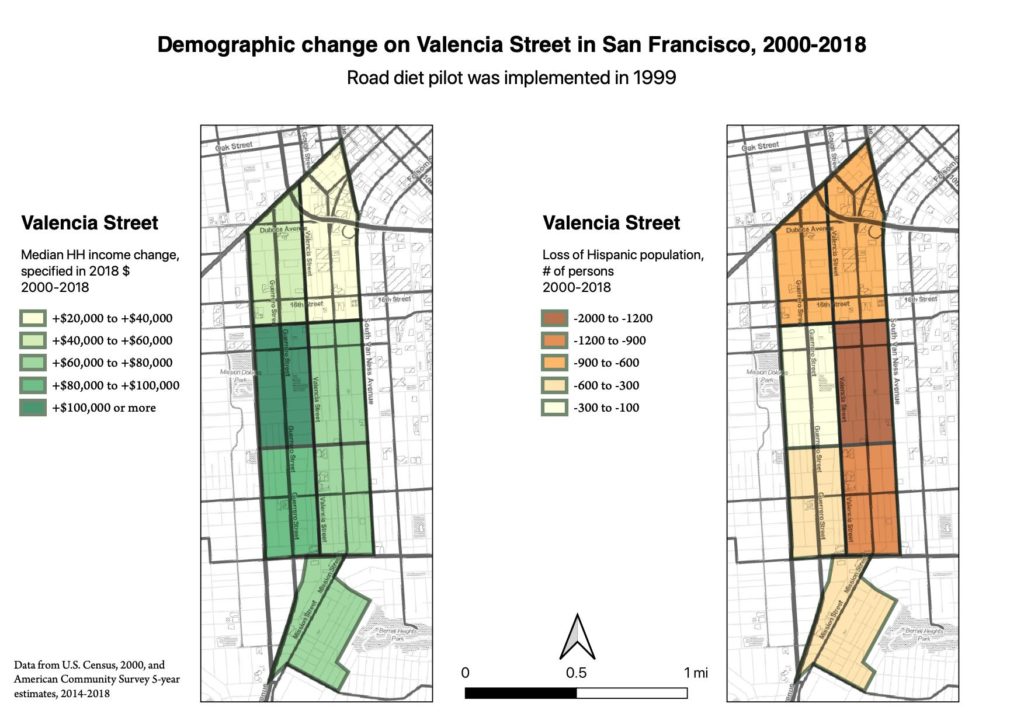
I have been really, really trying to avoid getting into the housing debate. But transportation and housing are inextricably linked, and my investigation of bike infrastructure’s relationship to gentrification is part of the Bike Lab’s work. A Twitter thread sparked by Phil Matier’s terrible SF Chronicle article led me to do some data analysis of Valencia Street’s transformation. Some of the results are pretty staggering.

Map of San Francisco showing Golden Gate Park and a selected census tract (67000) in the Outer Sunset

Error bar

Phil Matier is a terrible journalist. One of the ways in which he’s terrible is that he doesn’t understand statistics at all, or at least, the way he uses statistics in his writing is uninformed (at best) or intentionally misleading (at worst). I’ll be charitable and assume that the fallacies in his work come from a place of ignorance rather than deception.

Chart showing fatal crashes in Vision Zero cities from 2011-2018, gradually rising about 20%.

Revisiting a bad idea

My posts earlier this year suggesting that Vision Zero’s communications strategy of amplifying safety risks might be counter-productive received a little bit of attention. I wanted to revisit the analysis to include the 2018 data from both the ACS and FARS, and to address some methodological criticisms.

Biking while Black part 2: Racially-biased policing in Richmond, CA

Jesus Barajas suggested to me that Allwyn Brown in Richmond (CA) had done a lot of work to change the culture of RPD. And since I’m going up to Rich City Rides tomorrow, I thought I’d see if I could run some numbers there. Getting good data is hard, but I was able to find some sources. The story is, unfortunately, no more encouraging.

Map of Oakland, displaying the large number of stops in West and East Oakland, and the generally large proportion of African-Americans stopped in all police beats

Biking while Black: Racial bias in Oakland policing

After his arrest, Najari asked me to help out with research and data analysis on racially-biased policing in Oakland. Since then I’ve also been providing information to the team working on Let’s Bike Oakland, the bike plan update, and found that 68% of bike/ped stops in Oakland were of Blacks, who comprise 24% of the population. OPD argues that the bias is spatial rather than racial; they police more in Black neighborhoods because that’s where the crime is. Does that claim hold up under scrutiny? It turns out the answer is no: Blacks are significantly more likely to be stopped no matter where they are in the city.

More on a bad idea

My post on Vision Zero’s threat amplification communications strategy got some interesting responses. One class of response as a sigh of relief, from advocates and city officials who don’t want to adopt such a confrontational style. Another was an interest in comparison data; what happened in non-Vision Zero cities over the same time frames? An entirely reasonable question, and easy for me to research.

Scroll to Top