The Bike Lab began as an attempt to investigate the chicken-and-egg question of whether bike lanes led to gentrification, or gentrification led to bike lanes. In the end I found that the more interesting question was why we came to associate bike lanes with gentrification, given that the strongest predictor of urban cycling in the U.S. is being a low-income ethnic minority. But I can’t do a series on neighborhood change without talking about its relationship to cycling rates.
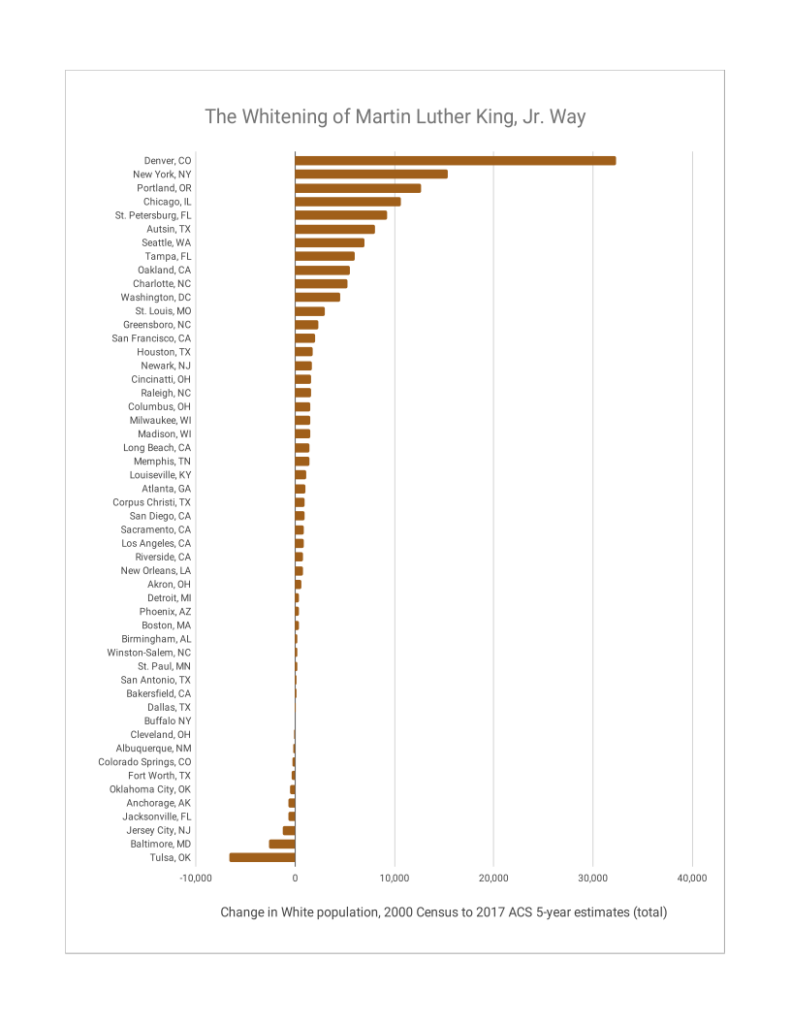
In these census tracts intersected by MLK Way, 49 of the 58 cities had increases in cycling mode share between 2000 and 2017, with the median increase being 0.5%. Here are the cities where cycling mode share increased by at least 2 percentage points:
| Bike mode share, % | Population, White, % | Population, Black, % | Population, White, % | Population, Black, % | |
|---|---|---|---|---|---|
| Change, 2000-2017 | Current | ||||
| Portland, OR | 9.7% | 15.1% | -14.2% | 72.4% | 10.6% |
| Detroit, MI | 4.1% | 5.5% | -8.0% | 22.2% | 61.9% |
| Sacramento, CA | 3.5% | 7.9% | -5.5% | 30.9% | 17.9% |
| Brooklyn, NY | 3.3% | 4.4% | -16.6% | 5.3% | 36.8% |
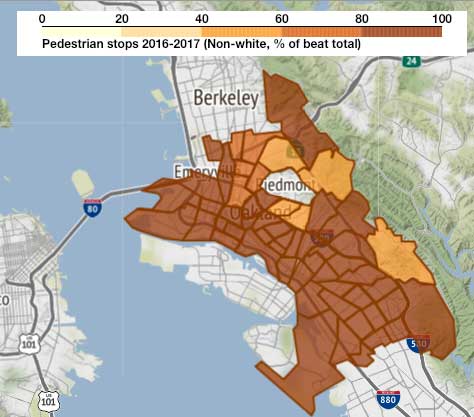
| Oakland, CA | 3.2% | 17.7% | -25.2% | 29.5% | 34.5% |
| San Francisco, CA | 2.7% | -5.0% | -0.2% | 39.1% | 1.1% |
| Louisville, KY | 2.4% | 15.2% | -14.4% | 51.1% | 42.9% |
| Denver, CO | 2.4% | 37.4% | -25.7% | 54.3% | 18.8% |
| Memphis, TN | 2.1% | 9.7% | -10.8% | 34.0% | 59.7% |
Portland’s presence at the top of the list is not a surprise. But I think Detroit showing up at #2 is fascinating. Martin Luther King Jr. Boulevard there is not far from downtown Detroit, and in 2000 had just 0.8% bicycle mode share, so cycling has increased by a factor of 5. Unlike most of the other cities on this list, particularly Portland, Oakland, Louisville, and Denver, which saw substantial displacement in these historically Black neighborhoods during the study period, Detroit saw only moderate displacement, and is still over 60% Black.
One of my research premises is that the social factors which contribute to cycling rates are under-studied and under-appreciated. And Detroit is home to one of the most interesting cultural events in the country, Slow Roll Detroit.
Slow Roll is a weekly community bike ride founded in 2010. It’s a little like Bike Party, but more family-oriented, sanctioned (with police escort), and explicitly focused on developing cycling culture and changing the image of the city. It regularly attracts thousands of riders, and I think it’s safe to say it’s a big factor in the cycling increase in the city.
I’m also fascinated to see Memphis, TN show up here. In the 2000 Census these tracts were recorded as having exactly zero commute cyclists. I had to go double-check that, and it looks correct. What brought cycling in these neighborhoods from zero to 2.1%? I hadn’t looked at Memphis at all to this point. They were selected as a Big Jump grant city by People for Bikes in 2017, but any impact of that selection would have occurred after this study period (the ACS 5-year period is 2013-2017).
Somehow during my research I missed a study published by Smiley et al. (2014) in Urban Studies that spoke to the relatively rapid increase in cycling in Memphis. (“Behind a Bicycling Boom: Governance, Cultural Change and Place Character in Memphis, Tennessee“), It found that an increase in cycling infrastructure was part of a governmental program to change places by building creative-class style amenities such as bike infrastructure, and suggested that those changes might “serve only some populations, namely creatives and pre-existing power structures, while maintaining traditions that exclude others and contribute to racialised gentrification.” But Bike/Ped Memphis responded to that study with some reasonable data questioning whether the increase in cycling was really concentrated in creative class populations; according to the 2013 3-year ACS data, more Black people were riding than whites. (I question, though, their choice of using the ACS 3-year summary, which has small sample sizes for sub-populations; I would want to investigate whether the 5-year data, which would be more appropriate to use in this analysis, would still support the article’s hypothesis as well.) I’ll definitely want to learn more about Memphis’ cycling culture.
In the end, bike infrastructure doesn’t itself reinforce the marginalization of communities, but bad process does (in the Bike Lab’s opinion). The problem is that we often implement bike infrastructure via bad process, and the Bike Lab’s project is to encourage the power structures of cycling advocacy to do a better job.
I saw this amazing post (How to think about power (especially if you have some)) from the Chorus Foundation (thanks to Urban Tilth’s Doria Robinson) about the responsibilities of those with structural power towards those who lack it. There’s a ton to digest there, and I think this bit is particularly relevant:
At Chorus, we support organizations that build power in communities that have historically had power used against them, e.g., communities of color, Indigenous communities and working-class communities. We believe that asking these communities to turn out for things that are “in their best interest” without also building power in their favor is at best insufficient and at worst deeply problematic.
What does it look like to build community power through cycling? It definitely doesn’t look like the North Minneapolis Greenway or Southern Walnut Creek Trail projects. I think it looks a lot like what Rich City Rides and the Original Scraper Bike Team do. It also looks a little bit like the Oakland Bike Plan outreach process. How do we spend more time (and money) supporting those kinds of efforts, and not just paint and concrete?